TECHNICAL ASSET FINGERPRINT
4c29c651fc3d8842556e2555
Click to view fullscreen
Press ESC or click to close
FOUND IN PAPERS
EXPERT: healer-alpha-free VERSION 1
RUNTIME: free/openrouter/healer-alpha
INTEL_VERIFIED
## Stacked Bar Chart: Model Performance Breakdown by Contribution Type
### Overview
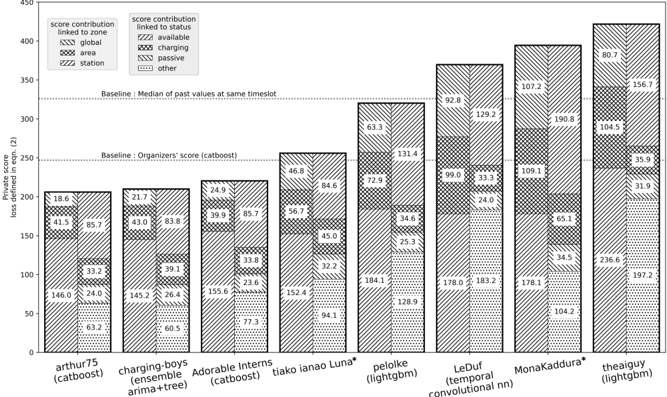
This image is a stacked bar chart comparing the performance of eight different machine learning models or methods. The performance metric is "log2 of the score," and the bars are segmented to show contributions from different factors related to "time" and "status." The chart includes two baseline reference lines.
### Components/Axes
* **Chart Title:** Not explicitly present, but the content suggests a title like "Model Score Decomposition by Time and Status Contributions."
* **Y-Axis:**
* **Label:** `log2 of the score`
* **Scale:** Linear scale from 0 to 450, with major tick marks every 50 units.
* **X-Axis:**
* **Label:** Not explicitly labeled, but contains categorical model names.
* **Categories (from left to right):**
1. `arthur75 (catboost)`
2. `charming-boys5 (ensemble arma+tree)`
3. `Adorable Interns (catboost)`
4. `tiako lanao Luna*`
5. `peloke (lightgbm)`
6. `LeBuf (temporal convolutional nn)`
7. `MonaKaddura*`
8. `theaiguy (lightgbm)`
* **Legends (Top-Left Corner):**
* **Legend 1: "score contribution linked to time"** (Position: Top-left, above the chart area)
* `global` (Pattern: Diagonal lines, top-left to bottom-right `\`)
* `area` (Pattern: Diagonal lines, top-right to bottom-left `/`)
* `station` (Pattern: Horizontal lines `-`)
* **Legend 2: "score contribution linked to status"** (Position: Immediately to the right of Legend 1)
* `available` (Pattern: Diagonal cross-hatch `X`)
* `busy` (Pattern: Vertical lines `|`)
* `passive` (Pattern: Dotted `...`)
* `other` (Pattern: Solid fill, appears as a light gray in the chart)
* **Baseline Reference Lines:**
* **Line 1:** `Baseline: Median of past values at same timeslot` (Dashed line, positioned at approximately y=310).
* **Line 2:** `Baseline: Organizers' score (catboost)` (Dotted line, positioned at approximately y=240).
### Detailed Analysis
Each bar is a stacked composite of segments representing contributions from the two legend categories. The total height of the bar represents the model's overall log2 score. The numerical value for each segment is printed directly on it.
**Trend Verification:** The overall trend shows a general increase in total score from left to right, with the rightmost models (`MonaKaddura*` and `theaiguy`) achieving the highest scores, surpassing both baselines.
**Bar-by-Bar Breakdown (Left to Right):**
1. **arthur75 (catboost)**
* **Total Height:** ~200
* **Segments (from bottom to top):**
* `station` (time): 63.2
* `global` (time): 148.8
* `other` (status): 24.0
* `passive` (status): 11.2
* `busy` (status): 41.5
* `available` (status): 16.6
* `area` (time): 83.7
2. **charming-boys5 (ensemble arma+tree)**
* **Total Height:** ~210
* **Segments (from bottom to top):**
* `station` (time): 60.5
* `global` (time): 145.2
* `other` (status): 28.4
* `passive` (status): 12.1
* `busy` (status): 43.0
* `available` (status): 21.7
* `area` (time): 83.8
3. **Adorable Interns (catboost)**
* **Total Height:** ~225
* **Segments (from bottom to top):**
* `station` (time): 77.3
* `global` (time): 155.6
* `other` (status): 28.4
* `passive` (status): 12.1
* `busy` (status): 43.0
* `available` (status): 24.8
* `area` (time): 83.8
4. **tiako lanao Luna***
* **Total Height:** ~250
* **Segments (from bottom to top):**
* `station` (time): 94.1
* `global` (time): 152.4
* `other` (status): 28.4
* `passive` (status): 12.1
* `busy` (status): 45.0
* `available` (status): 46.8
* `area` (time): 84.8
5. **peloke (lightgbm)**
* **Total Height:** ~320 (First to surpass the "Organizers' score" baseline)
* **Segments (from bottom to top):**
* `station` (time): 128.9
* `global` (time): 184.1
* `other` (status): 25.3
* `passive` (status): 34.6
* `busy` (status): 72.0
* `available` (status): 63.3
* `area` (time): 131.4
6. **LeBuf (temporal convolutional nn)**
* **Total Height:** ~370
* **Segments (from bottom to top):**
* `station` (time): 183.3
* `global` (time): 178.0
* `other` (status): 33.3
* `passive` (status): 33.3
* `busy` (status): 99.0
* `available` (status): 66.4
* `area` (time): 129.2
7. **MonaKaddura***
* **Total Height:** ~400 (Second highest)
* **Segments (from bottom to top):**
* `station` (time): 104.2
* `global` (time): 178.2
* `other` (status): 34.5
* `passive` (status): 34.5
* `busy` (status): 109.1
* `available` (status): 107.2
* `area` (time): 190.6
8. **theaiguy (lightgbm)**
* **Total Height:** ~420 (Highest score)
* **Segments (from bottom to top):**
* `station` (time): 197.2
* `global` (time): 238.6
* `other` (status): 21.9
* `passive` (status): 35.8
* `busy` (status): 104.5
* `available` (status): 80.7
* `area` (time): 108.7
### Key Observations
1. **Performance Tiers:** The models clearly fall into three performance tiers relative to the baselines. The first four models (`arthur75` to `tiako lanao Luna*`) are below both baselines. `peloke` and `LeBuf` are between the two baselines. `MonaKaddura*` and `theaiguy` are above both baselines.
2. **Dominant Contribution:** For all models, the `global` (time) and `station` (time) segments are consistently the largest contributors to the total score, forming the base of each bar.
3. **Status Contribution Growth:** The total contribution from "status" factors (`available`, `busy`, `passive`, `other`) increases noticeably for the higher-performing models, particularly the `available` and `busy` segments.
4. **Highest Contributor:** In the top-performing model (`theaiguy`), the single largest segment is `global` (time) at 238.6, which alone is higher than the total score of the first three models.
5. **Baseline Comparison:** The "Median of past values" baseline (~310) is a higher bar to clear than the "Organizers' score" (~240). Only the top two models exceed it.
### Interpretation
This chart decomposes the performance of various predictive models to understand *why* some perform better than others. The data suggests that superior performance is strongly associated with two factors:
1. **Mastery of Temporal Patterns:** The largest score components come from `global` and `station` time-linked contributions. The top models (`theaiguy`, `MonaKaddura*`) have exceptionally high values in these areas, indicating they are far better at leveraging historical and location-specific temporal patterns than the lower-ranked models.
2. **Effective Use of Status Information:** While less dominant than time factors, the ability to incorporate status information (`available`, `busy`) becomes a key differentiator among the mid-to-high-tier models. The top models show a more balanced and substantial contribution from these status variables.
The chart implies that the competition or task being measured heavily rewards models that can accurately model time-based trends. The models that only use basic temporal features (the leftmost ones) plateau below the organizers' benchmark. Advancing beyond that requires either more sophisticated temporal modeling (like `peloke`'s LightGBM or `LeBuf`'s temporal CNN) or the addition of robust status-based features, as seen in the top two models. The asterisk on `tiako lanao Luna*` and `MonaKaddura*` may indicate a special note or variant, but its meaning is not defined in the chart.
DECODING INTELLIGENCE...