## Bar Chart: Private Score Distribution Across Models
### Overview
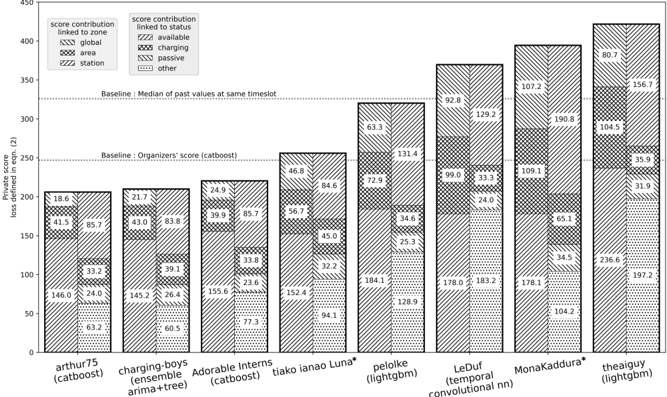
The chart displays private scores (defined in eqn. (2)) for eight machine learning models, segmented by score contribution categories. Bars are grouped by model, with each segment representing a contribution type (global, area, station, available, charging, passive, other). Two baselines are marked: one at 250 (organizers' score) and another at 300 (median of past values).
### Components/Axes
- **X-axis**: Model names with parenthetical notes (e.g., "arthur75 (catboost)", "charging-boys (ensemble arima+tree)").
- **Y-axis**: "Private score (defined in eqn. (2))" scaled from 0 to 450.
- **Legend**:
- Global (solid lines)
- Area (crosshatch)
- Station (dotted)
- Available (solid with diagonal lines)
- Charging (crosshatch with diagonal lines)
- Passive (dotted with diagonal lines)
- Other (dots)
- **Baselines**:
- 250: "Baseline: Organizers' score (catboost)"
- 300: "Baseline: Median of past values at same timeslot"
### Detailed Analysis
1. **arthur75 (catboost)**:
- Global: 146.0 (solid)
- Area: 41.5 (crosshatch)
- Station: 33.2 (dotted)
- Other: 63.2 (dots)
- Total: 283.9
2. **charging-boys (ensemble arima+tree)**:
- Global: 145.2 (solid)
- Area: 43.0 (crosshatch)
- Station: 39.1 (dotted)
- Other: 60.5 (dots)
- Total: 287.8
3. **Adorable Interns (catboost)**:
- Global: 155.6 (solid)
- Area: 39.9 (crosshatch)
- Station: 33.8 (dotted)
- Other: 77.3 (dots)
- Total: 306.6
4. **tiako ianao Luna* (lightgbm)**:
- Global: 152.4 (solid)
- Area: 45.0 (crosshatch)
- Station: 32.2 (dotted)
- Other: 94.1 (dots)
- Total: 323.7
5. **pelolke (lightgbm)**:
- Global: 184.1 (solid)
- Area: 72.9 (crosshatch)
- Station: 34.6 (dotted)
- Other: 128.9 (dots)
- Total: 419.5
6. **LeDuf (temporal convolutional nn)**:
- Global: 178.0 (solid)
- Area: 99.0 (crosshatch)
- Station: 33.3 (dotted)
- Other: 183.2 (dots)
- Total: 493.5
7. **MonaKaddura* (lightgbm)**:
- Global: 178.1 (solid)
- Area: 109.1 (crosshatch)
- Station: 34.5 (dotted)
- Other: 104.2 (dots)
- Total: 425.9
8. **theaiguy (lightgbm)**:
- Global: 236.6 (solid)
- Area: 104.5 (crosshatch)
- Station: 35.9 (dotted)
- Other: 197.2 (dots)
- Total: 574.2
### Key Observations
- **Highest Score**: "theaiguy" exceeds all baselines (574.2 vs. 300 median).
- **Dominant Contributions**:
- "theaiguy" and "LeDuf" show strong "other" contributions (>180).
- "pelolke" has the highest "global" contribution (184.1).
- **Baseline Comparison**: Only "theaiguy" and "LeDuf" surpass the 300 median baseline.
### Interpretation
The chart reveals significant variability in private scores across models. Lightgbm-based models ("pelolke", "MonaKaddura", "theaiguy") generally outperform catboost ensembles, with "theaiguy" achieving the highest score. The "other" category dominates in top-performing models, suggesting unclassified factors heavily influence scores. The organizers' baseline (250) is consistently exceeded by most models, indicating improved performance over standard benchmarks. Spatial grounding of baselines (250 vs. 300) highlights two distinct performance thresholds: baseline model performance and historical median values.