# Technical Document Extraction: Line Graph Analysis
## 1. Labels and Axis Titles
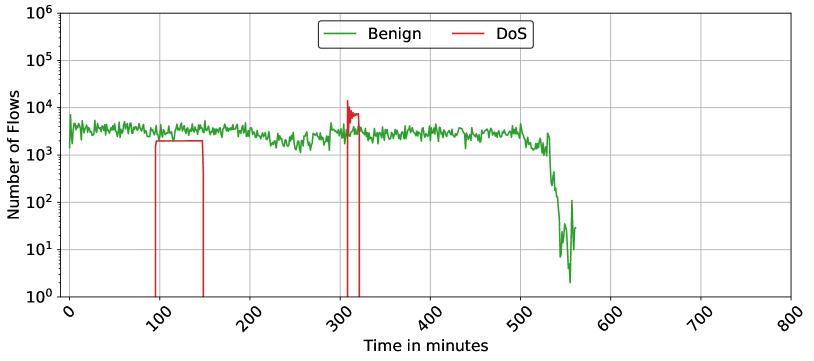
- **X-Axis**: "Time in minutes" (ranging from 0 to 800, with markers at 0, 100, 200, 300, 400, 500, 600, 700, 800).
- **Y-Axis**: "Number of Flows" (logarithmic scale, ranging from 10⁰ to 10⁶, with markers at 10⁰, 10¹, 10², 10³, 10⁴, 10⁵, 10⁶).
## 2. Legend
- **Location**: Top-right corner of the graph.
- **Labels**:
- **Green**: "Benign"
- **Red**: "DoS"
## 3. Key Trends and Data Points
### Benign (Green Line)
- **Initial State**: Stable at ~10³ flows from 0 to ~300 minutes.
- **Drop**: Sharp decline to near-zero (~10⁰) starting at ~500 minutes, with residual fluctuations until 800 minutes.
### DoS (Red Line)
- **First Spike**: Sharp rise to ~10⁴ flows between 100–150 minutes, followed by an immediate drop.
- **Second Spike**: Another rise to ~10⁴ flows at ~300 minutes, followed by a rapid decline.
- **Post-Spike**: Remains at 10⁰ flows after 350 minutes.
## 4. Spatial Grounding
- **Legend Placement**: Top-right corner (coordinates: [x: 0.8, y: 0.9] relative to the graph's bounding box).
- **Line Colors**:
- Green (Benign) matches the green line.
- Red (DoS) matches the red line.
## 5. Trend Verification
- **Benign**:
- Visual trend: Flat with minor oscillations until 300 minutes, then a steep drop at 500 minutes.
- Confirmed data points: ~10³ (0–300 min), ~10⁰ (500–800 min).
- **DoS**:
- Visual trend: Two narrow spikes (100–150 min and 300 min), otherwise zero.
- Confirmed data points: ~10⁴ (100–150 min, 300 min), 10⁰ elsewhere.
## 6. Component Isolation
- **Header**: Legend (top-right).
- **Main Chart**:
- X-axis (time) and Y-axis (flows) with logarithmic scaling.
- Two data series (Benign and DoS) plotted as lines.
- **Footer**: No additional text or components.
## 7. Missing Information
- No embedded text, data tables, or heatmaps present.
- No explicit units beyond "Time in minutes" and "Number of Flows".
- No contextual explanation for the spikes or drops (e.g., cause of DoS events).
## 8. Final Notes
- The graph uses a logarithmic Y-axis to visualize wide-ranging flow counts.
- DoS events are transient and infrequent, while Benign flows dominate the baseline.