\n
## Grid: Binary Pattern
### Overview
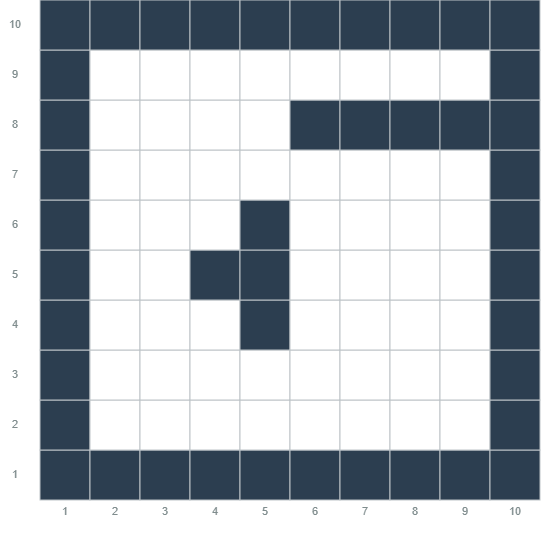
The image displays a 10x10 grid with cells colored either dark blue or white, forming a binary pattern. The grid is oriented with the origin (1,1) in the bottom-left corner and extends to (10,10) in the top-right corner. The axes are labeled with numerical values from 1 to 10. There is no legend.
### Components/Axes
* **X-axis:** Labeled with integers from 1 to 10, increasing from left to right.
* **Y-axis:** Labeled with integers from 1 to 10, increasing from bottom to top.
* **Cells:** Each cell represents a point in the grid, colored either dark blue or white.
### Detailed Analysis or Content Details
The pattern consists of dark blue cells arranged in a specific configuration. We can describe the location of the dark blue cells as follows:
* (1,1) to (1,10): Continuous dark blue cells along the bottom row.
* (2,1) to (2,3): Dark blue cells.
* (3,1) to (3,3): Dark blue cells.
* (4,1): Dark blue cell.
* (4,5): Dark blue cell.
* (5,4) to (5,6): Continuous dark blue cells.
* (6,1): Dark blue cell.
* (6,7) to (6,10): Continuous dark blue cells along the top row.
* (7,7) to (7,10): Continuous dark blue cells.
* (8,7) to (8,10): Continuous dark blue cells.
* (9,7) to (9,10): Continuous dark blue cells.
* (10,7) to (10,10): Continuous dark blue cells.
The white cells fill the remaining spaces in the grid.
### Key Observations
The pattern appears to be a stylized representation of the letter "E" or a similar shape, constructed from the dark blue cells. The pattern is symmetrical around a vertical axis. The pattern is not random; it follows a defined structure.
### Interpretation
The image likely represents a visual code or a simple graphic. The binary nature of the grid (dark blue/white) suggests a digital or computational context. The shape formed by the dark blue cells could be a symbol, a character in a custom font, or a visual element in a larger design. Without additional context, the precise meaning of the pattern remains ambiguous. The pattern could be a simplified representation of a more complex data set, where dark blue indicates a specific state or value and white indicates another. The grid structure suggests a discrete space, potentially representing a matrix or a set of coordinates.