## Grid Diagram: 10x10 Matrix with Filled Cells
### Overview
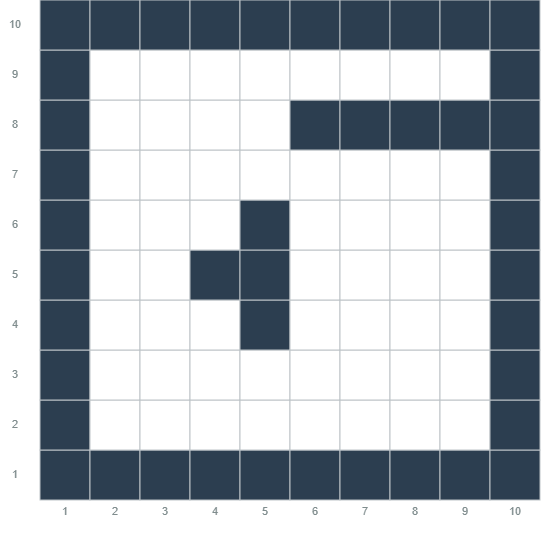
The image depicts a 10x10 grid with specific cells filled in black. The grid is labeled with numerical indices from 1 to 10 along both the horizontal (x-axis) and vertical (y-axis) axes. No explicit legend or axis titles are present, but the filled cells suggest a structured pattern or data representation.
### Components/Axes
- **X-axis (horizontal)**: Labeled 1 to 10, positioned at the bottom of the grid.
- **Y-axis (vertical)**: Labeled 1 to 10, positioned on the left side of the grid.
- **Filled cells**: Black squares located at specific coordinates, forming a border and a central block.
### Detailed Analysis
- **Border pattern**:
- **Top row (y=1)**: All cells from x=1 to x=10 are filled.
- **Bottom row (y=10)**: All cells from x=1 to x=10 are filled.
- **Left column (x=1)**: All cells from y=1 to y=10 are filled.
- **Right column (x=10)**: All cells from y=1 to y=10 are filled.
- **Central block**:
- A 2x2 block of filled cells located at coordinates (5,4), (5,5), (6,4), (6,5).
### Key Observations
1. The grid forms a complete border around the edges, with all cells in the first and last rows and columns filled.
2. A smaller 2x2 block of filled cells is centered near the middle of the grid (coordinates 5-6 on the x-axis and 4-5 on the y-axis).
3. No other cells are filled, creating a stark contrast between the border and the central block.
### Interpretation
The diagram likely represents a structured layout or data distribution. The filled border could symbolize a boundary or perimeter, while the central 2x2 block might indicate a focal point or critical region. The absence of a legend or axis titles leaves the exact purpose ambiguous, but the pattern suggests a deliberate design, such as a maze, a matrix with specific constraints, or a visual representation of a mathematical or logical structure. The central block’s placement near the center (but not exactly at the center) may imply asymmetry or a specific positional significance.