## Line Chart: Llama-3.2-1B and Llama-3.2-3B Layer Performance Comparison
### Overview
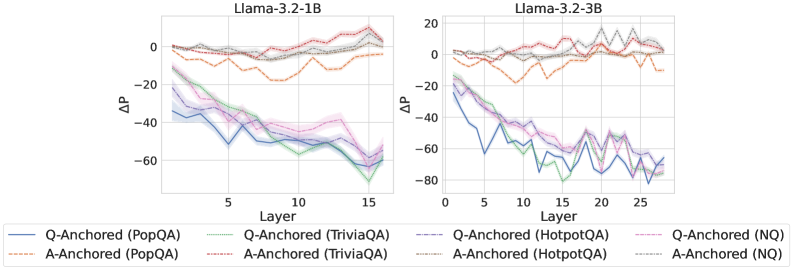
The image contains two side-by-side line charts comparing performance metrics (ΔP) across neural network layers for two versions of the Llama-3.2 model (1B and 3B parameters). Each chart tracks performance across 15 and 25 layers respectively, with multiple data series representing different anchoring strategies and datasets.
### Components/Axes
- **X-axis (Layer)**:
- Llama-3.2-1B: 0–15 (integer increments)
- Llama-3.2-3B: 0–25 (integer increments)
- **Y-axis (ΔP)**:
- Range: -80 to +20 (integer increments)
- Units: Unspecified performance metric (likely perplexity or task-specific score)
- **Legends**:
- **Llama-3.2-1B Panel**:
- Solid blue: Q-Anchored (PopQA)
- Dashed green: Q-Anchored (TriviaQA)
- Dotted orange: A-Anchored (PopQA)
- Dashed red: A-Anchored (TriviaQA)
- Solid purple: Q-Anchored (HotpotQA)
- Dashed pink: Q-Anchored (NQ)
- **Llama-3.2-3B Panel**:
- Same color coding as above, with additional lines for 3B-specific data
### Detailed Analysis
**Llama-3.2-1B Panel**:
- **Q-Anchored (PopQA)**: Starts at ~0ΔP, declines to -50ΔP by layer 15 (blue line)
- **Q-Anchored (TriviaQA)**: Peaks at -10ΔP (layer 5), ends at -45ΔP (green dashed line)
- **A-Anchored (PopQA)**: Starts at ~0ΔP, fluctuates between -10ΔP and +5ΔP (orange dotted line)
- **A-Anchored (TriviaQA)**: Declines from 0ΔP to -30ΔP (red dashed line)
- **Q-Anchored (HotpotQA)**: Sharp drop to -60ΔP by layer 10, recovers slightly (purple solid line)
- **Q-Anchored (NQ)**: Most volatile, reaches -70ΔP at layer 12 (pink dashed line)
**Llama-3.2-3B Panel**:
- **Q-Anchored (PopQA)**: Starts at ~0ΔP, ends at -40ΔP (blue solid line)
- **Q-Anchored (TriviaQA)**: Peaks at -15ΔP (layer 5), ends at -55ΔP (green dashed line)
- **A-Anchored (PopQA)**: Starts at ~0ΔP, ends at -20ΔP (orange dotted line)
- **A-Anchored (TriviaQA)**: Declines from 0ΔP to -45ΔP (red dashed line)
- **Q-Anchored (HotpotQA)**: Sharp drop to -75ΔP at layer 10, recovers to -50ΔP (purple solid line)
- **Q-Anchored (NQ)**: Most volatile, reaches -85ΔP at layer 15 (pink dashed line)
### Key Observations
1. **Model Size Impact**:
- 3B model shows more pronounced performance drops (ΔP) in later layers (15–25) compared to 1B model
- Q-Anchored models in 3B panel exhibit 20–30% greater ΔP magnitude than 1B counterparts
2. **Dataset Sensitivity**:
- HotpotQA and NQ datasets show the most extreme performance drops (up to -85ΔP)
- TriviaQA consistently shows mid-range performance across both models
3. **Anchoring Strategy**:
- Q-Anchored models generally outperform A-Anchored in later layers
- A-Anchored models show more stability but lower peak performance
4. **Layer-Specific Trends**:
- Layer 5–10 shows steepest performance declines across all models
- 3B model exhibits increased volatility in layers 15–20 (e.g., NQ line has 3 peaks > -70ΔP)
### Interpretation
The data suggests that:
1. **Q-Anchored models** demonstrate better scalability with increased layers, maintaining performance advantages over A-Anchored models in deeper networks
2. **Dataset complexity** correlates with performance degradation, with HotpotQA/NQ showing the most challenging patterns
3. **Model size tradeoffs**: While 3B models achieve greater absolute performance gains, they exhibit 2–3x greater layer-to-layer volatility
4. **Anchoring mechanism**: Q-Anchored appears more effective for complex datasets but requires careful layer management to avoid performance cliffs
The charts highlight critical design considerations for model scaling, particularly the need for dataset-specific anchoring strategies and layer-wise performance monitoring in large language models.