## Line Charts: Training and Testing Accuracy vs. Epoch
### Overview
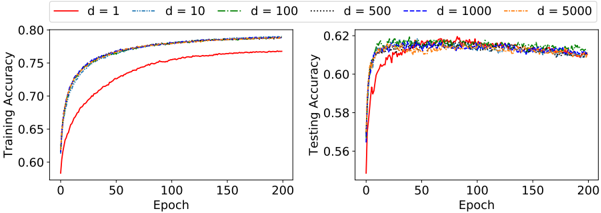
The image presents two line charts side-by-side, illustrating the training accuracy (left) and testing accuracy (right) of a model over 200 epochs. Each chart displays multiple lines, each representing a different value of 'd' (likely a hyperparameter). The charts aim to show how the training and testing accuracy change with the number of epochs for different values of 'd'.
### Components/Axes
* **X-axis (both charts):** Epoch, ranging from 0 to 200. Increments are marked at 0, 50, 100, 150, and 200.
* **Y-axis (left chart):** Training Accuracy, ranging from 0.60 to 0.80. Increments are not explicitly marked, but the scale is linear.
* **Y-axis (right chart):** Testing Accuracy, ranging from 0.56 to 0.62. Increments are not explicitly marked, but the scale is linear.
* **Legend (top):** Located above the charts, the legend identifies each line by its 'd' value:
* Red: d = 1
* Teal dashed: d = 10
* Green dash-dot: d = 100
* Black dotted: d = 500
* Blue dashed: d = 1000
* Orange: d = 5000
### Detailed Analysis
**Left Chart: Training Accuracy**
* **d = 1 (Red):** Starts at approximately 0.59 and increases rapidly until around epoch 50, reaching approximately 0.74. It then continues to increase at a slower rate, reaching approximately 0.76 by epoch 200.
* **d = 10 (Teal dashed):** Starts at approximately 0.61 and increases rapidly until around epoch 25, reaching approximately 0.75. It then plateaus and slowly increases to approximately 0.79 by epoch 200.
* **d = 100 (Green dash-dot):** Starts at approximately 0.61 and increases rapidly until around epoch 25, reaching approximately 0.75. It then plateaus and slowly increases to approximately 0.79 by epoch 200.
* **d = 500 (Black dotted):** Starts at approximately 0.61 and increases rapidly until around epoch 25, reaching approximately 0.75. It then plateaus and slowly increases to approximately 0.79 by epoch 200.
* **d = 1000 (Blue dashed):** Starts at approximately 0.61 and increases rapidly until around epoch 25, reaching approximately 0.75. It then plateaus and slowly increases to approximately 0.79 by epoch 200.
* **d = 5000 (Orange):** Starts at approximately 0.61 and increases rapidly until around epoch 25, reaching approximately 0.75. It then plateaus and slowly increases to approximately 0.79 by epoch 200.
**Right Chart: Testing Accuracy**
* **d = 1 (Red):** Starts at approximately 0.56 and increases rapidly until around epoch 20, reaching approximately 0.61. It then plateaus and fluctuates around 0.61 for the remaining epochs.
* **d = 10 (Teal dashed):** Starts at approximately 0.59 and increases rapidly until around epoch 20, reaching approximately 0.61. It then plateaus and fluctuates around 0.61 for the remaining epochs.
* **d = 100 (Green dash-dot):** Starts at approximately 0.60 and increases rapidly until around epoch 20, reaching approximately 0.61. It then plateaus and fluctuates around 0.61 for the remaining epochs.
* **d = 500 (Black dotted):** Starts at approximately 0.60 and increases rapidly until around epoch 20, reaching approximately 0.61. It then plateaus and fluctuates around 0.61 for the remaining epochs.
* **d = 1000 (Blue dashed):** Starts at approximately 0.60 and increases rapidly until around epoch 20, reaching approximately 0.61. It then plateaus and fluctuates around 0.61 for the remaining epochs.
* **d = 5000 (Orange):** Starts at approximately 0.60 and increases rapidly until around epoch 20, reaching approximately 0.61. It then plateaus and fluctuates around 0.61 for the remaining epochs.
### Key Observations
* The training accuracy consistently increases with the number of epochs for all values of 'd', but the rate of increase slows down after approximately 50 epochs.
* The testing accuracy increases rapidly in the initial epochs and then plateaus, showing little improvement after approximately 20 epochs.
* For training accuracy, d=1 performs significantly worse than the other values of d.
* For testing accuracy, the different values of 'd' do not seem to have a significant impact on the final accuracy.
### Interpretation
The charts suggest that increasing the value of 'd' beyond 1 improves the training accuracy, but it does not significantly affect the testing accuracy. This could indicate that higher values of 'd' lead to overfitting, where the model performs well on the training data but does not generalize well to unseen data. The plateau in testing accuracy suggests that the model has reached its maximum performance on the testing dataset, and further training may not lead to significant improvements. The model with d=1 is likely underfitting the data.