## Line Graphs: Training and Testing Accuracy vs. Epochs
### Overview
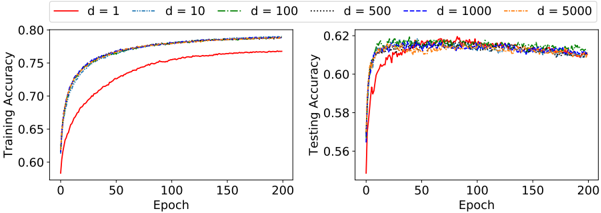
The image contains two line graphs comparing training and testing accuracy across different model dimensions (d=1, 10, 100, 500, 1000, 5000) over 200 epochs. The graphs show how accuracy evolves during training and testing phases for varying model complexities.
### Components/Axes
- **Left Graph (Training Accuracy)**:
- **X-axis**: Epoch (0 to 200, linear scale).
- **Y-axis**: Training Accuracy (0.60 to 0.80, linear scale).
- **Legend**: Located at the top-right. Colors and line styles correspond to dimensions:
- Red solid: d=1
- Blue dashed: d=10
- Green dash-dot: d=100
- Purple dotted: d=500
- Dark blue dash-dot-dot: d=1000
- Orange dotted: d=5000
- **Right Graph (Testing Accuracy)**:
- **X-axis**: Epoch (0 to 200, linear scale).
- **Y-axis**: Testing Accuracy (0.56 to 0.62, linear scale).
- **Legend**: Same as the left graph, with identical color/style mappings.
### Detailed Analysis
#### Training Accuracy (Left Graph)
- **d=1 (Red)**: Starts at ~0.60, rises steeply to ~0.75 by epoch 50, then plateaus. Final accuracy ~0.75.
- **d=10 (Blue Dashed)**: Similar trajectory to d=1 but slightly higher (~0.77 by epoch 50, plateauing at ~0.78).
- **d=100 (Green Dash-Dot)**: Reaches ~0.78 by epoch 50, plateaus at ~0.79.
- **d=500 (Purple Dotted)**: Peaks at ~0.79 by epoch 50, stabilizes at ~0.795.
- **d=1000 (Dark Blue Dash-Dot-Dot)**: Slightly higher than d=500 (~0.798 by epoch 50, plateauing at ~0.80).
- **d=5000 (Orange Dotted)**: Highest training accuracy (~0.80 by epoch 50, plateauing at ~0.805).
#### Testing Accuracy (Right Graph)
- **d=1 (Red)**: Starts at ~0.56, rises to ~0.60 by epoch 50, then plateaus at ~0.60.
- **d=10 (Blue Dashed)**: Reaches ~0.61 by epoch 50, plateaus at ~0.61.
- **d=100 (Green Dash-Dot)**: Peaks at ~0.615 by epoch 50, stabilizes at ~0.61.
- **d=500 (Purple Dotted)**: Slightly higher (~0.618 by epoch 50, plateauing at ~0.615).
- **d=1000 (Dark Blue Dash-Dot-Dot)**: Peaks at ~0.62 by epoch 50, stabilizes at ~0.615.
- **d=5000 (Orange Dotted)**: Highest testing accuracy (~0.618 by epoch 50, plateauing at ~0.615).
### Key Observations
1. **Training vs. Testing**: Training accuracy consistently exceeds testing accuracy across all dimensions, suggesting potential overfitting in lower dimensions (e.g., d=1, d=10).
2. **Diminishing Returns**: Higher dimensions (d=500, 1000, 5000) achieve similar performance, indicating minimal gains beyond d=100.
3. **Convergence**: Lines for d=100, 500, 1000, and 5000 converge in both graphs, suggesting saturation of model capacity.
4. **Early Epoch Behavior**: All dimensions show rapid improvement in the first 50 epochs, followed by stabilization.
### Interpretation
The data demonstrates that increasing model dimensionality improves both training and testing accuracy up to a point (d=100–500). Beyond this, performance plateaus, implying that excessive complexity does not yield significant benefits. The gap between training and testing accuracy widens for lower dimensions (d=1–10), highlighting overfitting risks. The convergence of lines in both graphs suggests that models with d≥100 achieve near-optimal performance, making them preferable for balancing accuracy and computational efficiency. The testing accuracy ceiling (~0.62) indicates inherent limitations in the dataset or task complexity.