## Chart: Search Error
### Overview
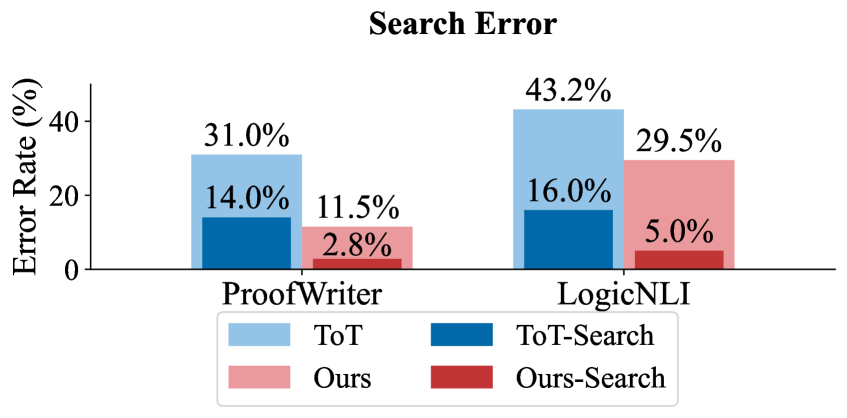
The image is a bar chart comparing the search error rates of different models (ToT, Ours) with and without search, across two datasets (ProofWriter, LogicNLI). The y-axis represents the error rate in percentage, and the x-axis represents the datasets. The chart includes a legend to distinguish between the different models and their search variants.
### Components/Axes
* **Title:** Search Error
* **Y-axis:** Error Rate (%)
* Scale: 0% to 40%
* **X-axis:** Datasets (ProofWriter, LogicNLI)
* **Legend:** Located at the bottom of the chart.
* ToT (light blue)
* ToT-Search (dark blue)
* Ours (light red)
* Ours-Search (dark red)
### Detailed Analysis
The chart presents error rates for four different configurations across two datasets.
**ProofWriter Dataset:**
* ToT: 31.0%
* ToT-Search: 14.0%
* Ours: 11.5%
* Ours-Search: 2.8%
**LogicNLI Dataset:**
* ToT: 43.2%
* ToT-Search: 16.0%
* Ours: 29.5%
* Ours-Search: 5.0%
### Key Observations
* For both datasets, the "Search" variants (ToT-Search and Ours-Search) consistently exhibit lower error rates compared to their non-search counterparts (ToT and Ours).
* The LogicNLI dataset generally shows higher error rates across all configurations compared to the ProofWriter dataset.
* "Ours-Search" achieves the lowest error rate in both datasets.
### Interpretation
The data suggests that incorporating a search mechanism significantly reduces the error rate for both the "ToT" and "Ours" models. The "Ours-Search" model appears to be the most effective, achieving the lowest error rates across both datasets. The higher error rates on the LogicNLI dataset might indicate that this dataset is more challenging for these models. The chart highlights the benefit of using search algorithms to improve the performance of these models in terms of reducing search errors.