\n
## Bar Chart: Search Error
### Overview
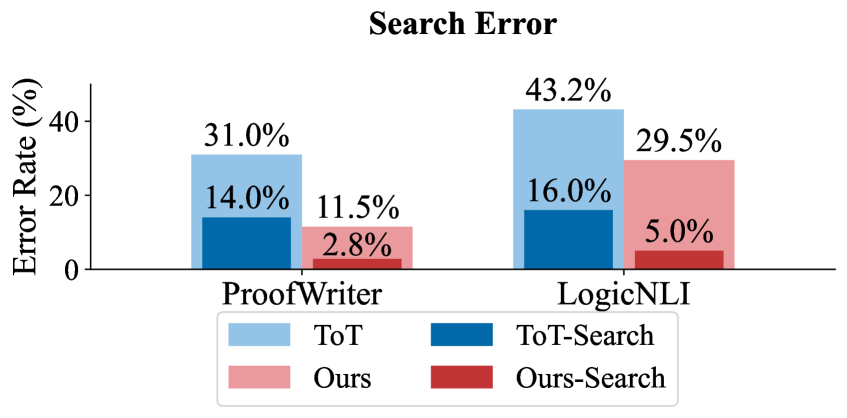
This bar chart compares the error rates of different search methods (ToT, Ours, ToT-Search, Ours-Search) across two datasets (ProofWriter and LogicNLI). The error rate is measured in percentage (%). The chart uses stacked bars to represent the contribution of each method to the overall error rate.
### Components/Axes
* **Title:** "Search Error" (centered at the top)
* **X-axis:** Datasets - "ProofWriter" and "LogicNLI" (horizontally aligned at the bottom)
* **Y-axis:** Error Rate (%) - ranging from 0% to 45% (vertically aligned on the left)
* **Legend:** Located at the bottom-right corner.
* "ToT" - Light Blue
* "ToT-Search" - Dark Blue
* "Ours" - Light Red
* "Ours-Search" - Dark Red
### Detailed Analysis
The chart consists of two sets of stacked bars, one for each dataset.
**ProofWriter Dataset:**
* **ToT (Light Blue):** Approximately 31.0%
* **ToT-Search (Dark Blue):** Approximately 14.0%
* **Ours (Light Red):** Approximately 11.5%
* **Ours-Search (Dark Red):** Approximately 2.8%
* Total Error Rate: 31.0% + 14.0% + 11.5% + 2.8% = 59.3% (This is not a direct reading from the chart, but the sum of the stacked components)
**LogicNLI Dataset:**
* **ToT (Light Blue):** Approximately 43.2%
* **ToT-Search (Dark Blue):** Approximately 16.0%
* **Ours (Light Red):** Approximately 29.5%
* **Ours-Search (Dark Red):** Approximately 5.0%
* Total Error Rate: 43.2% + 16.0% + 29.5% + 5.0% = 93.7% (This is not a direct reading from the chart, but the sum of the stacked components)
The bars are stacked, meaning the height of each segment represents the error rate contributed by that specific method.
### Key Observations
* "Ours-Search" consistently exhibits the lowest error rate across both datasets.
* "ToT" has the highest error rate in the LogicNLI dataset.
* The total error rate is significantly higher for the LogicNLI dataset compared to the ProofWriter dataset.
* The "Ours" method has a higher error rate than "ToT-Search" in the ProofWriter dataset, but a lower error rate in the LogicNLI dataset.
### Interpretation
The chart demonstrates the effectiveness of the "Ours-Search" method in reducing search errors compared to other methods ("ToT", "ToT-Search", and "Ours") across both datasets. The LogicNLI dataset presents a higher overall error rate, suggesting it is a more challenging dataset for all search methods. The performance difference between "Ours" and "ToT-Search" varies depending on the dataset, indicating that the optimal method may depend on the specific characteristics of the data. The stacked bar format effectively visualizes the contribution of each method to the overall error rate, allowing for a clear comparison of their performance. The data suggests that the "Ours-Search" method is a significant improvement over the other methods, particularly in reducing the overall error rate.