## Bar Chart: Search Error Rate Comparison
### Overview
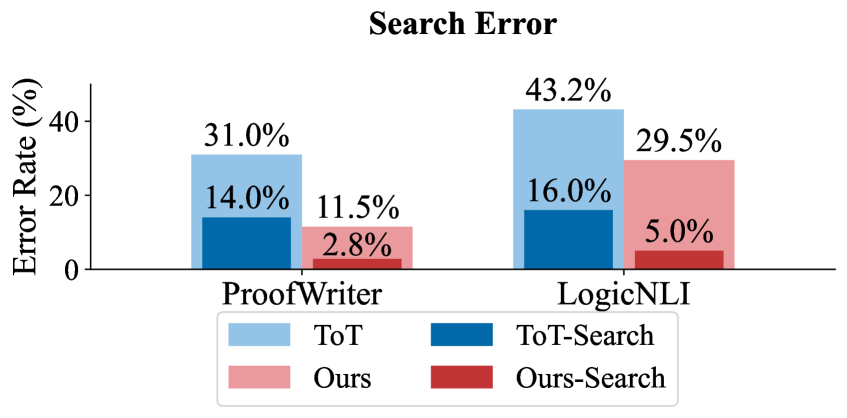
The image is a grouped bar chart titled "Search Error" that compares the error rates (in percentage) of four different methods across two datasets: "ProofWriter" and "LogicNLI". The chart visually demonstrates the performance impact of adding a search component to two base methods ("ToT" and "Ours").
### Components/Axes
* **Chart Title:** "Search Error" (centered at the top).
* **Y-Axis:** Labeled "Error Rate (%)". The axis has numerical markers at 0, 20, and 40.
* **X-Axis:** Contains two categorical labels: "ProofWriter" (left group) and "LogicNLI" (right group).
* **Legend:** Positioned at the bottom center of the chart. It defines four data series by color:
* Light Blue: "ToT"
* Dark Blue: "ToT-Search"
* Light Red/Pink: "Ours"
* Dark Red: "Ours-Search"
### Detailed Analysis
The chart presents data for two distinct datasets, each with four associated methods.
**1. ProofWriter Dataset (Left Group):**
* **ToT (Light Blue Bar):** The tallest bar in this group, with a labeled value of **31.0%**.
* **ToT-Search (Dark Blue Bar):** A significantly shorter bar, with a labeled value of **14.0%**.
* **Ours (Light Red Bar):** Slightly shorter than the ToT-Search bar, with a labeled value of **11.5%**.
* **Ours-Search (Dark Red Bar):** The shortest bar in the entire chart, with a labeled value of **2.8%**.
**2. LogicNLI Dataset (Right Group):**
* **ToT (Light Blue Bar):** The tallest bar in the entire chart, with a labeled value of **43.2%**.
* **ToT-Search (Dark Blue Bar):** A much shorter bar, with a labeled value of **16.0%**.
* **Ours (Light Red Bar):** The second-tallest bar in this group, with a labeled value of **29.5%**.
* **Ours-Search (Dark Red Bar):** The shortest bar in this group, with a labeled value of **5.0%**.
### Key Observations
* **Consistent Trend of Improvement with Search:** For both base methods ("ToT" and "Ours") and on both datasets, the addition of a search component ("-Search") results in a substantial reduction in error rate.
* **"Ours-Search" is the Top Performer:** The dark red "Ours-Search" method achieves the lowest error rate in both datasets (2.8% on ProofWriter, 5.0% on LogicNLI).
* **"ToT" Has the Highest Error Rates:** The light blue "ToT" method has the highest error rate in both datasets (31.0% and 43.2%).
* **Relative Performance:** The "Ours" method (light red) consistently outperforms the "ToT" method (light blue) without search. With search, "Ours-Search" (dark red) consistently outperforms "ToT-Search" (dark blue).
* **Dataset Difficulty:** Error rates are universally higher on the LogicNLI dataset compared to ProofWriter for all corresponding methods, suggesting LogicNLI may be a more challenging task.
### Interpretation
This chart provides strong empirical evidence for two key conclusions within the context of the research it represents:
1. **The Efficacy of Search:** The primary finding is that integrating a search mechanism dramatically improves performance (lowers error rates) for both the "ToT" and the proposed "Ours" methodology. The magnitude of improvement is significant, often reducing the error rate by more than half (e.g., ToT from 31.0% to 14.0% on ProofWriter).
2. **Superiority of the Proposed Method:** The data suggests that the authors' method ("Ours") is fundamentally more effective than the baseline "ToT" method. This is true in both its standalone form and, more importantly, when augmented with search. The "Ours-Search" combination is presented as the state-of-the-art result in this comparison, achieving near-negligible error rates on the ProofWriter task.
The chart is designed to persuade the viewer that the authors' approach ("Ours") is not only better than the existing method ("ToT") but that its advantage is amplified when both are enhanced with search capabilities. The consistent pattern across two different datasets strengthens the generalizability of this claim.