## Heatmap: All Lengths
### Overview
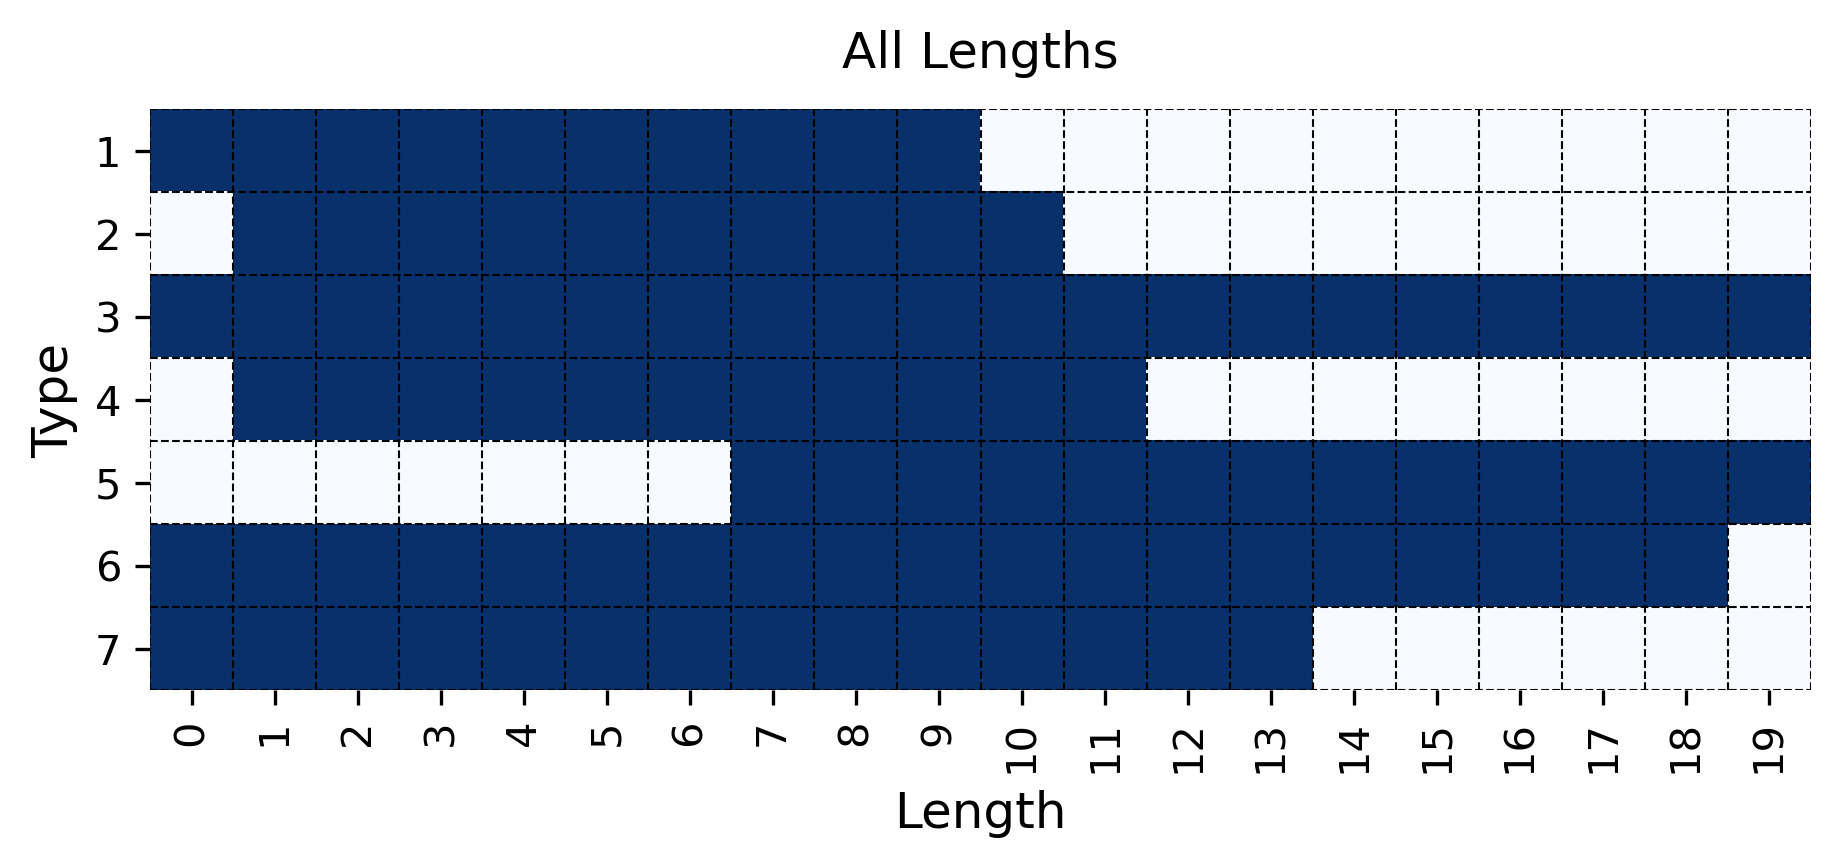
The image is a heatmap visualizing the presence (dark blue) or absence (light blue) of certain "Types" across different "Lengths". The x-axis represents "Length" ranging from 0 to 19, and the y-axis represents "Type" ranging from 1 to 7.
### Components/Axes
* **Title:** All Lengths
* **X-axis:**
* Label: Length
* Scale: 0, 1, 2, 3, 4, 5, 6, 7, 8, 9, 10, 11, 12, 13, 14, 15, 16, 17, 18, 19
* **Y-axis:**
* Label: Type
* Scale: 1, 2, 3, 4, 5, 6, 7
* **Data Representation:**
* Dark Blue: Indicates presence or existence.
* Light Blue: Indicates absence or non-existence.
### Detailed Analysis
Here's a breakdown of the presence (dark blue) and absence (light blue) for each type across the lengths:
* **Type 1:** Present from Length 0 to approximately Length 10. Absent from Length 11 to 19.
* **Type 2:** Present from Length 0 to approximately Length 11. Absent from Length 12 to 19.
* **Type 3:** Present from Length 0 to Length 19.
* **Type 4:** Absent at Length 0. Present from Length 1 to approximately Length 12. Absent from Length 13 to 19.
* **Type 5:** Absent from Length 0 to approximately Length 3. Present from Length 4 to approximately Length 7. Absent from Length 8 to 19.
* **Type 6:** Present from Length 0 to approximately Length 18. Absent at Length 19.
* **Type 7:** Present from Length 0 to approximately Length 13. Absent from Length 14 to 19.
### Key Observations
* Type 3 is present across all lengths (0-19).
* Type 5 has the shortest continuous presence, only existing between lengths 4 and 7.
* Types 1, 2, 4, 6, and 7 have a presence that starts at length 0, but they do not extend to length 19.
### Interpretation
The heatmap visualizes the distribution of different "Types" across various "Lengths". The dark blue cells indicate where a particular type exists for a given length, while the light blue cells indicate absence. The data suggests that Type 3 is universally present across all lengths, while other types have more restricted ranges. The heatmap provides a clear overview of the length profiles for each type, allowing for easy comparison and identification of patterns.