\n
## Heatmap: All Lengths
### Overview
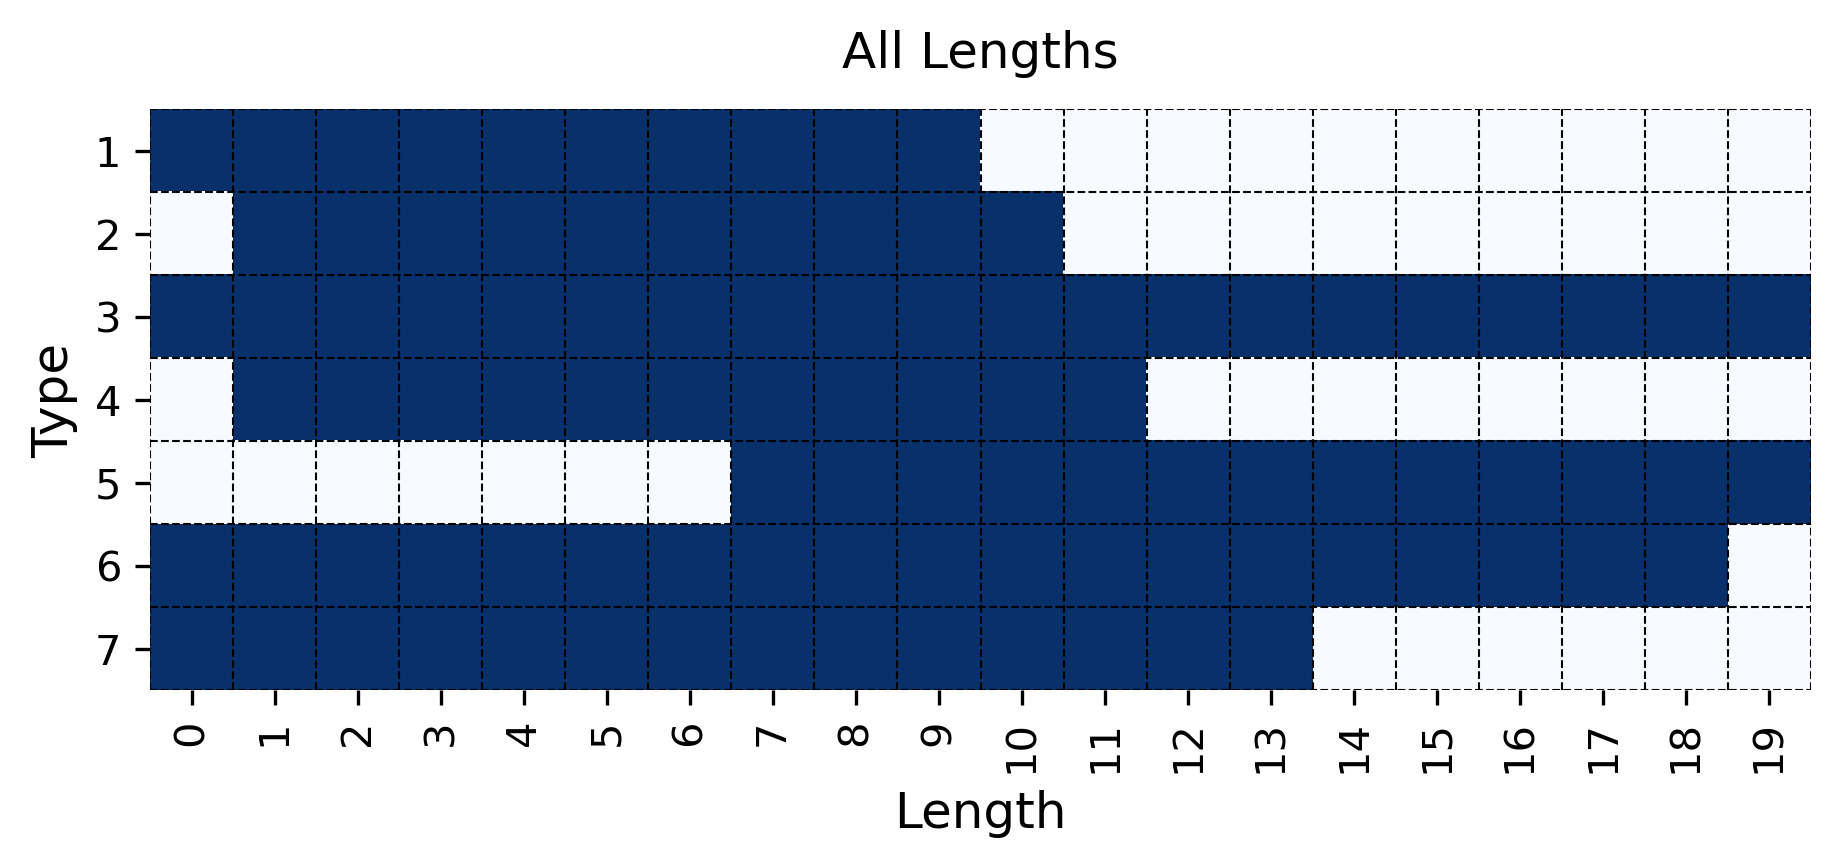
The image presents a heatmap visualizing the distribution of data across two dimensions: 'Type' and 'Length'. The heatmap uses a color gradient to represent the density or frequency of occurrences for each combination of type and length. Darker shades of blue indicate higher frequency, while lighter shades (white) indicate lower or zero frequency. The grid is overlaid on a white background with a light gray grid.
### Components/Axes
* **Title:** "All Lengths" - positioned at the top-center of the image.
* **X-axis:** "Length" - ranging from 0 to 19, with integer values marked as axis ticks.
* **Y-axis:** "Type" - ranging from 1 to 7, with integer values marked as axis ticks.
* **Color Scale:** The heatmap uses a single color (blue) with varying intensity to represent the data. Darker blue indicates higher frequency, and white indicates zero frequency.
### Detailed Analysis
The heatmap shows the frequency of each 'Type' for each 'Length'. The data can be summarized as follows (approximating values based on visual inspection):
* **Type 1:** High frequency for Lengths 0-9, then drops to zero for Lengths 10-19.
* **Type 2:** High frequency for Lengths 0-11, then drops to zero for Lengths 12-19.
* **Type 3:** High frequency for Lengths 0-18, then drops to zero for Length 19.
* **Type 4:** High frequency for Lengths 0-4, then zero for Lengths 5-19.
* **Type 5:** High frequency for Lengths 5-7, then zero for Lengths 0-4 and 8-19.
* **Type 6:** High frequency for Lengths 7-14, then zero for Lengths 0-6 and 15-19.
* **Type 7:** High frequency for Lengths 12-19, then zero for Lengths 0-11.
Specifically:
* **Type 1:** Approximately 100% frequency for Lengths 0-9, 0% for Lengths 10-19.
* **Type 2:** Approximately 100% frequency for Lengths 0-11, 0% for Lengths 12-19.
* **Type 3:** Approximately 100% frequency for Lengths 0-18, 0% for Length 19.
* **Type 4:** Approximately 100% frequency for Lengths 0-4, 0% for Lengths 5-19.
* **Type 5:** Approximately 100% frequency for Lengths 5-7, 0% for Lengths 0-4 and 8-19.
* **Type 6:** Approximately 100% frequency for Lengths 7-14, 0% for Lengths 0-6 and 15-19.
* **Type 7:** Approximately 100% frequency for Lengths 12-19, 0% for Lengths 0-11.
### Key Observations
* The heatmap exhibits a clear pattern of Type-specific Length ranges. Each Type is concentrated within a specific range of Lengths, with minimal overlap.
* There is a distinct shift in the dominant Type as Length increases. Lower Lengths are dominated by Types 1, 2, 3, and 4. Mid-range Lengths are dominated by Types 5 and 6. Higher Lengths are dominated by Type 7.
* The transitions between Type dominance are relatively sharp, indicating a strong correlation between Type and Length.
### Interpretation
The data suggests a strong relationship between 'Type' and 'Length'. The heatmap demonstrates that different Types are associated with different Length ranges. This could represent a categorization of items based on their length, where each Type represents a distinct category. The sharp transitions between Type dominance suggest that Length is a key differentiating factor between these categories. The data could be used to predict the Type of an item based on its Length, or vice versa. The absence of data in certain cells (white areas) indicates that those combinations of Type and Length are not observed in the dataset. This could be due to inherent limitations of the system being measured, or it could indicate a genuine absence of such combinations.