## Heatmap Diagram: Optimization Problem Visualizations
### Overview
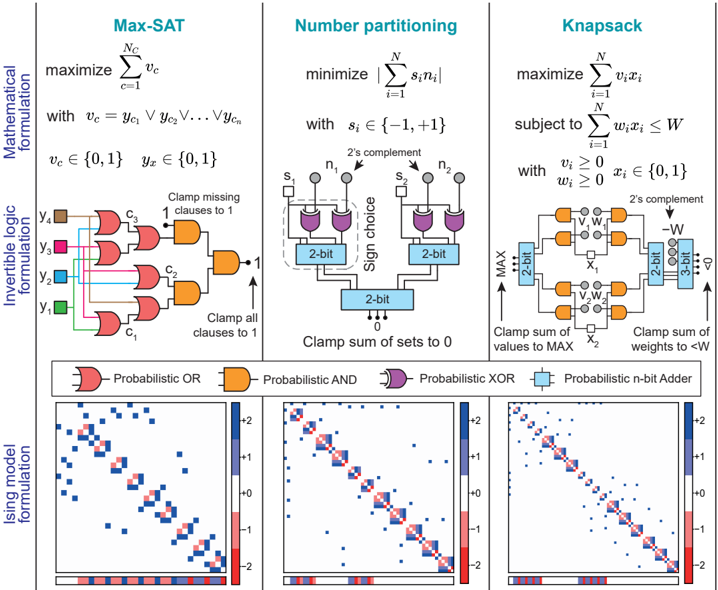
The image presents three distinct optimization problem visualizations (Max-SAT, Number Partitioning, Knapsack) with corresponding mathematical formulations, logic diagrams, and heatmaps. Each section includes probabilistic logic gates, constraint diagrams, and 2D heatmaps with color-coded values.
### Components/Axes
#### Mathematical Formulations
1. **Max-SAT**
- **Objective**: Maximize ∑ₐ=1^N v_c with v_c = y_c1 ∨ y_c2 ∨ ... ∨ y_cn
- **Variables**: v_c ∈ {0,1}, y_x ∈ {0,1}
- **Logic Diagram**: Probabilistic OR gates with clamps (missing clauses set to 1).
2. **Number Partitioning**
- **Objective**: Minimize |∑ᵢ=1^N s_i n_i| with s_i ∈ {-1, +1}
- **Components**: 2-bit adders, sign choice modules, and clamping to 0.
3. **Knapsack**
- **Objective**: Maximize ∑ᵢ=1^N v_i x_i subject to ∑ᵢ=1^N w_i x_i ≤ W
- **Constraints**: v_i ≥ 0, w_i ≥ 0, x_i ∈ {0,1}
- **Logic Diagram**: MAX gates, 2-bit adders, and weight clamping.
#### Heatmap Details
- **Axes**:
- X-axis: Unlabeled (likely represents variable indices or clauses).
- Y-axis: Unlabeled (likely represents variable indices or clauses).
- **Color Scale**:
- Red: -2 (low probability/value)
- Blue: +2 (high probability/value)
- White: 0 (neutral/undefined).
- **Legend**:
- Positioned at the bottom of the heatmaps.
- Colors:
- Red: Probabilistic OR/AND/XOR gates.
- Blue: Probabilistic n-bit adder.
### Detailed Analysis
#### Max-SAT Heatmap
- **Trend**: Diagonal bands of red and blue squares suggest variable dependencies.
- **Values**:
- Top-left: Red (-2) dominates, indicating low clause satisfaction.
- Bottom-right: Blue (+2) appears, suggesting high clause satisfaction.
#### Number Partitioning Heatmap
- **Trend**: Symmetric red-blue diagonal pattern implies balanced partitioning.
- **Values**:
- Center: White (0) indicates neutral sums.
- Edges: Red (-2) and blue (+2) show extreme imbalances.
#### Knapsack Heatmap
- **Trend**: Diagonal red-blue gradient reflects trade-offs between value and weight.
- **Values**:
- Top-right: Blue (+2) indicates high-value, low-weight solutions.
- Bottom-left: Red (-2) shows low-value, high-weight solutions.
### Key Observations
1. **Diagonal Patterns**: All heatmaps exhibit diagonal trends, suggesting variable interactions (e.g., clauses, weights, sums).
2. **Clamping Effects**: Logic diagrams show clamps forcing values to 0/1 or MAX, aligning with heatmap extremes.
3. **Color Consistency**: Red (-2) and blue (+2) consistently represent minima/maxima across all heatmaps.
### Interpretation
- **Max-SAT**: The heatmap visualizes clause satisfaction probabilities, with red/blue diagonals indicating variable interactions. Clamping ensures all clauses are satisfied (set to 1).
- **Number Partitioning**: The symmetric heatmap reflects the challenge of balancing subsets, with clamping to 0 enforcing equality.
- **Knapsack**: The gradient highlights the trade-off between maximizing value and minimizing weight, with clamping ensuring constraints are met.
- **Uncertainty**: Axis labels are unlabeled, making precise variable indexing ambiguous. The heatmaps lack explicit numerical annotations, relying on color scales for interpretation.
## Conclusion
The image demonstrates how probabilistic logic and constraint diagrams map to optimization problems, with heatmaps providing intuitive visualizations of solution distributions. The diagonal patterns and clamping mechanisms are critical for understanding variable dependencies and constraint satisfaction.