\n
## Diagram: Spurious Correlation and Environment Shift
### Overview
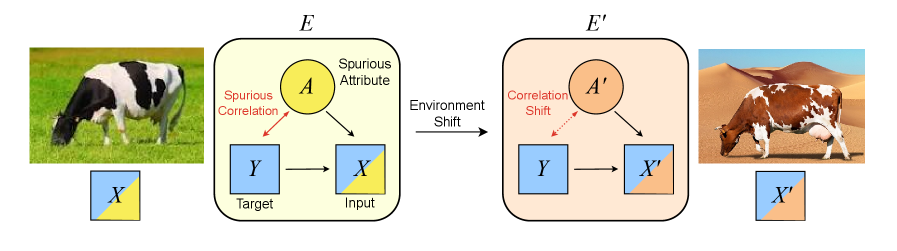
The image is a diagram illustrating the concept of spurious correlation in machine learning and how it is affected by environment shift. It depicts two environments, *E* and *E'*, each containing an image of a cow, and associated boxes representing input (X, X'), target (Y), and a spurious attribute (A, A'). Arrows indicate relationships between these elements.
### Components/Axes
The diagram consists of two main sections, labeled *E* (left) and *E'* (right), separated by an arrow labeled "Environment Shift". Within each section are the following components:
* **Image of a Cow:** A photograph of a cow in a grassy field (in *E*) and a cow in a desert environment (in *E'*).
* **X (Input):** A blue square with a yellow triangle at the bottom-left.
* **Y (Target):** A light-blue square.
* **A (Spurious Attribute):** A yellow circle.
* **X' (Input):** A blue square with an orange triangle at the bottom-left.
* **A' (Spurious Attribute):** A yellow circle.
* **Arrows:** Red arrows labeled "Spurious Correlation" (in *E*) and "Correlation Shift" (in *E'*) connect the spurious attribute (A, A') to the input (X, X'). A solid black arrow connects the target (Y) to the input (X, X').
### Detailed Analysis / Content Details
The diagram illustrates a scenario where a model learns to associate the target (Y) with the input (X), but this association is influenced by a spurious attribute (A).
* **Environment E:** The input X is connected to the target Y. The spurious attribute A is also connected to the input X via a red arrow labeled "Spurious Correlation". The image shows a cow in a green field.
* **Environment E':** The input X' is connected to the target Y. The spurious attribute A' is also connected to the input X' via a dashed red arrow labeled "Correlation Shift". The image shows a cow in a desert.
The positioning of the elements is consistent across both environments, with the target (Y) always connected to the input (X or X'). The spurious attribute (A or A') is always connected to the input (X or X') via a red arrow.
### Key Observations
The key observation is the shift in correlation between the spurious attribute and the input when the environment changes from *E* to *E'*. The solid arrow in *E* indicates a strong spurious correlation, while the dashed arrow in *E'* suggests a weakened or altered correlation. This demonstrates how a model trained in environment *E* might perform poorly in environment *E'* due to its reliance on the spurious attribute.
### Interpretation
This diagram illustrates a common problem in machine learning called spurious correlation. A model might learn to rely on features that are correlated with the target variable in the training data but are not actually causal. When the environment changes, these spurious correlations can break down, leading to poor generalization performance.
The diagram highlights the importance of understanding the underlying causal relationships between features and the target variable, and of being aware of potential spurious correlations. The "Environment Shift" arrow emphasizes that models should be robust to changes in the environment. The change from a solid to a dashed line for the correlation indicates that the spurious correlation is no longer as strong or reliable in the new environment. The different backgrounds (green field vs. desert) visually represent the change in environment and the potential for different spurious correlations to exist. The diagram is a conceptual illustration and does not contain specific numerical data.