## Chart: Spearman's RankCC vs. Number of Samples
### Overview
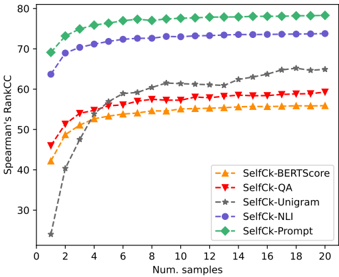
The image is a line chart comparing Spearman's Rank Correlation Coefficient (RankCC) for different methods (SelfCk-BERTScore, SelfCk-QA, SelfCk-Unigram, SelfCk-NLI, and SelfCk-Prompt) against the number of samples used. The chart shows how the RankCC changes as the number of samples increases from 0 to 20.
### Components/Axes
* **Title:** Spearman's RankCC
* **X-axis:** Num. samples (Number of samples), ranging from 0 to 20 in increments of 2.
* **Y-axis:** Spearman's RankCC, ranging from 0 to 80 in increments of 10.
* **Legend:** Located on the right side of the chart.
* SelfCk-BERTScore (Orange, triangle marker)
* SelfCk-QA (Red, inverted triangle marker)
* SelfCk-Unigram (Gray, star marker)
* SelfCk-NLI (Blue, circle marker)
* SelfCk-Prompt (Green, diamond marker)
### Detailed Analysis
* **SelfCk-BERTScore (Orange, triangle marker):** The line starts at approximately 42 at sample size 1, rises sharply to approximately 53 by sample size 4, and then plateaus around 56-57 from sample size 14 onwards.
* **SelfCk-QA (Red, inverted triangle marker):** The line starts at approximately 46 at sample size 1, rises sharply to approximately 55 by sample size 4, and then plateaus around 59-60 from sample size 14 onwards.
* **SelfCk-Unigram (Gray, star marker):** The line starts at approximately 24 at sample size 1, rises sharply to approximately 58 by sample size 6, and then gradually increases to approximately 64 by sample size 20.
* **SelfCk-NLI (Blue, circle marker):** The line starts at approximately 64 at sample size 1, rises sharply to approximately 73 by sample size 4, and then plateaus around 73-74 from sample size 8 onwards.
* **SelfCk-Prompt (Green, diamond marker):** The line starts at approximately 69 at sample size 1, rises sharply to approximately 77 by sample size 4, and then plateaus around 77-78 from sample size 8 onwards.
### Key Observations
* SelfCk-Prompt consistently achieves the highest Spearman's RankCC across all sample sizes.
* SelfCk-Unigram starts with the lowest RankCC but shows a steady increase as the number of samples grows.
* SelfCk-NLI and SelfCk-Prompt reach a plateau relatively quickly, indicating diminishing returns with increasing sample size.
* SelfCk-BERTScore and SelfCk-QA show similar trends, with a sharp initial increase followed by a plateau.
### Interpretation
The chart demonstrates the performance of different methods in terms of Spearman's RankCC as the number of samples increases. SelfCk-Prompt appears to be the most effective method, achieving the highest correlation with fewer samples. SelfCk-Unigram, while initially underperforming, shows a continuous improvement with more samples, suggesting it might benefit from larger datasets. The plateauing of SelfCk-NLI and SelfCk-Prompt suggests that increasing the sample size beyond a certain point does not significantly improve their performance. The data suggests that the choice of method and the number of samples should be carefully considered to optimize the Spearman's RankCC.