## Line Chart: Self-Check Method Performance vs. Sample Size
### Overview
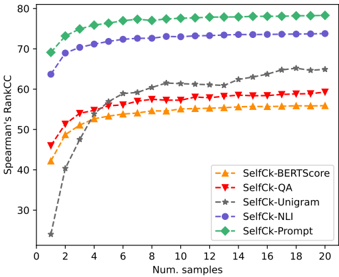
The image displays a line chart comparing the performance of five different "SelfCk" (Self-Check) methods for evaluating text generation. Performance is measured by Spearman's Rank Correlation Coefficient (Spearman's RankCC) on the Y-axis against the number of samples used on the X-axis. The chart demonstrates how each method's correlation with a reference metric improves and eventually plateaus as more samples are utilized.
### Components/Axes
* **Chart Type:** Multi-series line chart with markers.
* **Y-Axis:**
* **Label:** `Spearman's RankCC`
* **Scale:** Linear, ranging from 30 to 80.
* **Major Ticks:** 30, 40, 50, 60, 70, 80.
* **X-Axis:**
* **Label:** `Num. samples`
* **Scale:** Linear, ranging from 0 to 20.
* **Major Ticks:** 0, 2, 4, 6, 8, 10, 12, 14, 16, 18, 20.
* **Legend:**
* **Position:** Bottom-right corner of the plot area.
* **Entries (from top to bottom as listed):**
1. `SelfCk-BERTScore` - Orange line with upward-pointing triangle markers (▲).
2. `SelfCk-QA` - Red line with downward-pointing triangle markers (▼).
3. `SelfCk-Unigram` - Gray dashed line with star markers (★).
4. `SelfCk-NLI` - Purple line with circle markers (●).
5. `SelfCk-Prompt` - Green line with diamond markers (◆).
### Detailed Analysis
**Trend Verification & Data Point Extraction (Approximate Values):**
1. **SelfCk-Prompt (Green Diamonds, Top Line):**
* **Trend:** Rises very steeply from 1 to ~4 samples, then continues a shallow ascent before plateauing.
* **Data Points:** Starts at ~68 (1 sample). Reaches ~75 by 4 samples. Plateaus at approximately 78-79 from 8 samples onward to 20 samples.
2. **SelfCk-NLI (Purple Circles, Second Line):**
* **Trend:** Similar shape to SelfCk-Prompt but consistently lower. Steep initial rise followed by a plateau.
* **Data Points:** Starts at ~64 (1 sample). Reaches ~70 by 4 samples. Plateaus at approximately 73-74 from 10 samples onward.
3. **SelfCk-Unigram (Gray Stars, Dashed Line):**
* **Trend:** Starts the lowest but shows the most dramatic relative improvement. Has a very steep, near-linear climb from 1 to ~6 samples, then continues a steady, more gradual increase without a clear plateau within the shown range.
* **Data Points:** Starts at ~25 (1 sample). Crosses 50 at ~4 samples. Reaches ~60 by 10 samples. Ends at approximately 65 at 20 samples.
4. **SelfCk-QA (Red Inverted Triangles, Fourth Line):**
* **Trend:** Moderate initial rise, then plateaus relatively early.
* **Data Points:** Starts at ~46 (1 sample). Reaches ~58 by 6 samples. Plateaus at approximately 59-60 from 8 samples onward.
5. **SelfCk-BERTScore (Orange Triangles, Bottom Line):**
* **Trend:** Similar early plateau pattern to SelfCk-QA but at a lower performance level.
* **Data Points:** Starts at ~42 (1 sample). Reaches ~55 by 6 samples. Plateaus at approximately 56 from 8 samples onward.
**Spatial Grounding & Cross-Reference:** The legend order (BERTScore, QA, Unigram, NLI, Prompt) does not match the vertical order of the lines on the chart. The correct performance hierarchy from highest to lowest is: Prompt (Green) > NLI (Purple) > Unigram (Gray) > QA (Red) > BERTScore (Orange). This is consistent across all sample sizes after the first point.
### Key Observations
1. **Performance Hierarchy:** A clear and consistent ranking exists among the methods: `SelfCk-Prompt` > `SelfCk-NLI` > `SelfCk-Unigram` > `SelfCk-QA` > `SelfCk-BERTScore`.
2. **Diminishing Returns:** All methods show diminishing returns. The most significant gains occur within the first 4-6 samples. After 10 samples, improvements are marginal for most methods except `SelfCk-Unigram`, which continues a slow climb.
3. **Convergence Behavior:** `SelfCk-Prompt` and `SelfCk-NLI` converge to a high-performance plateau. `SelfCk-QA` and `SelfCk-BERTScore` converge to a lower plateau. `SelfCk-Unigram` has not fully converged by 20 samples.
4. **Outlier Trend:** `SelfCk-Unigram` is an outlier in its trajectory. It starts as the worst-performing method by a large margin but exhibits the steepest and most sustained improvement, eventually surpassing `SelfCk-QA` and `SelfCk-BERTScore`.
### Interpretation
This chart evaluates the effectiveness and efficiency of different self-check methods for text generation evaluation, using correlation with an external metric (Spearman's RankCC) as the proxy for quality.
* **What the data suggests:** Prompt-based (`SelfCk-Prompt`) and Natural Language Inference-based (`SelfCk-NLI`) self-check methods are the most effective, achieving high correlation with fewer samples and maintaining a strong lead. This suggests leveraging the reasoning capabilities of language models (via prompts or NLI) yields more reliable self-assessment than lexical overlap (`Unigram`) or other semantic similarity metrics (`BERTScore`, `QA`).
* **How elements relate:** The X-axis (`Num. samples`) represents the computational cost or effort. The chart answers the question: "How much performance gain do we get for investing in more samples?" The answer is highly method-dependent. For practical application, `SelfCk-Prompt` offers the best performance with minimal samples (e.g., 4-6). `SelfCk-Unigram` may be a low-cost alternative if many samples can be generated, as it continues to improve.
* **Notable Anomalies:** The dramatic rise of `SelfCk-Unigram` indicates that simple n-gram matching is highly unreliable with very few samples but becomes progressively more valid as the sample pool grows, likely because it begins to capture the distribution of possible outputs. The early plateau of `BERTScore` suggests it may be hitting a fundamental ceiling in its ability to correlate with the target metric, regardless of sample size.
**Language Declaration:** All text in the image is in English.