## Chart: Interleaved Performance Metrics
### Overview
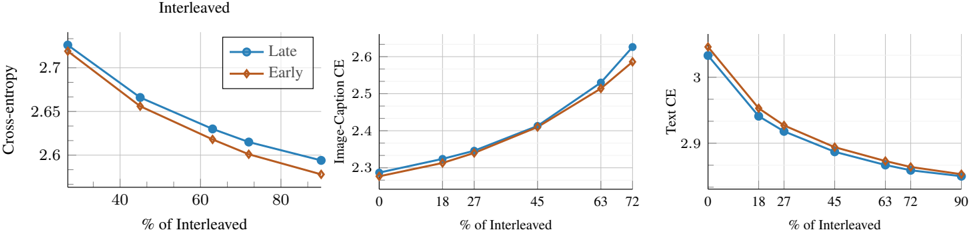
The image presents three line charts comparing the performance of "Late" and "Early" models across varying percentages of interleaved data. The charts depict Cross-entropy, Image-Caption Cross-entropy (CE), and Text Cross-entropy (CE) as a function of the percentage of interleaved data.
### Components/Axes
**General Layout:**
* The image contains three separate line charts arranged horizontally.
* Each chart has a horizontal axis representing "% of Interleaved" and a vertical axis representing a different performance metric.
* A legend in the top-center distinguishes between the "Late" (blue line with circle markers) and "Early" (brown line with diamond markers) models.
**Chart 1: Cross-entropy**
* **Y-axis:** "Cross-entropy" ranging from 2.6 to 2.7. Axis markers at 2.6, 2.65, and 2.7.
* **X-axis:** "% of Interleaved" ranging from 40 to 80. Axis markers at 40, 60, and 80.
* **Legend:** Located at the top-center of the image. "Late" is represented by a blue line with circle markers. "Early" is represented by a brown line with diamond markers.
**Chart 2: Image-Caption CE**
* **Y-axis:** "Image-Caption CE" ranging from 2.3 to 2.6. Axis markers at 2.3, 2.4, 2.5, and 2.6.
* **X-axis:** "% of Interleaved" ranging from 0 to 72. Axis markers at 0, 18, 27, 45, 63, and 72.
* **Legend:** Located at the top-center of the image. "Late" is represented by a blue line with circle markers. "Early" is represented by a brown line with diamond markers.
**Chart 3: Text CE**
* **Y-axis:** "Text CE" ranging from 2.8 to 3.1. Axis markers at 2.9 and 3.
* **X-axis:** "% of Interleaved" ranging from 0 to 90. Axis markers at 0, 18, 27, 45, 63, 72, and 90.
* **Legend:** Located at the top-center of the image. "Late" is represented by a blue line with circle markers. "Early" is represented by a brown line with diamond markers.
### Detailed Analysis
**Chart 1: Cross-entropy**
* **Late (Blue):** The line slopes downward.
* At 40% Interleaved, Cross-entropy is approximately 2.72.
* At 60% Interleaved, Cross-entropy is approximately 2.63.
* At 80% Interleaved, Cross-entropy is approximately 2.61.
* **Early (Brown):** The line slopes downward.
* At 40% Interleaved, Cross-entropy is approximately 2.71.
* At 60% Interleaved, Cross-entropy is approximately 2.65.
* At 80% Interleaved, Cross-entropy is approximately 2.59.
**Chart 2: Image-Caption CE**
* **Late (Blue):** The line slopes upward.
* At 0% Interleaved, Image-Caption CE is approximately 2.29.
* At 18% Interleaved, Image-Caption CE is approximately 2.31.
* At 27% Interleaved, Image-Caption CE is approximately 2.34.
* At 45% Interleaved, Image-Caption CE is approximately 2.41.
* At 63% Interleaved, Image-Caption CE is approximately 2.51.
* At 72% Interleaved, Image-Caption CE is approximately 2.65.
* **Early (Brown):** The line slopes upward.
* At 0% Interleaved, Image-Caption CE is approximately 2.28.
* At 18% Interleaved, Image-Caption CE is approximately 2.31.
* At 27% Interleaved, Image-Caption CE is approximately 2.35.
* At 45% Interleaved, Image-Caption CE is approximately 2.40.
* At 63% Interleaved, Image-Caption CE is approximately 2.53.
* At 72% Interleaved, Image-Caption CE is approximately 2.58.
**Chart 3: Text CE**
* **Late (Blue):** The line slopes downward.
* At 0% Interleaved, Text CE is approximately 3.05.
* At 18% Interleaved, Text CE is approximately 2.94.
* At 27% Interleaved, Text CE is approximately 2.91.
* At 45% Interleaved, Text CE is approximately 2.87.
* At 63% Interleaved, Text CE is approximately 2.84.
* At 72% Interleaved, Text CE is approximately 2.83.
* At 90% Interleaved, Text CE is approximately 2.81.
* **Early (Brown):** The line slopes downward.
* At 0% Interleaved, Text CE is approximately 3.03.
* At 18% Interleaved, Text CE is approximately 2.95.
* At 27% Interleaved, Text CE is approximately 2.90.
* At 45% Interleaved, Text CE is approximately 2.85.
* At 63% Interleaved, Text CE is approximately 2.83.
* At 72% Interleaved, Text CE is approximately 2.82.
* At 90% Interleaved, Text CE is approximately 2.81.
### Key Observations
* For Cross-entropy (Chart 1), both "Late" and "Early" models show a decrease in Cross-entropy as the percentage of interleaved data increases.
* For Image-Caption CE (Chart 2), both "Late" and "Early" models show an increase in Image-Caption CE as the percentage of interleaved data increases.
* For Text CE (Chart 3), both "Late" and "Early" models show a decrease in Text CE as the percentage of interleaved data increases.
* The "Late" and "Early" models perform similarly across all three metrics, with slight variations.
### Interpretation
The charts suggest that interleaving data has a varying impact on different aspects of model performance. As the percentage of interleaved data increases:
* Overall Cross-entropy decreases, which could indicate better overall model performance or generalization.
* Image-Caption CE increases, which might suggest that the model struggles more with image-caption alignment when data is interleaved.
* Text CE decreases, which could indicate improved text processing or understanding.
The similar performance of "Late" and "Early" models suggests that the timing of the model's processing (early vs. late) does not significantly affect its performance in these interleaved scenarios. The specific reasons for these trends would require further investigation into the model architectures and the nature of the interleaved data.