## Line Charts: Interleaved Training Metrics
### Overview
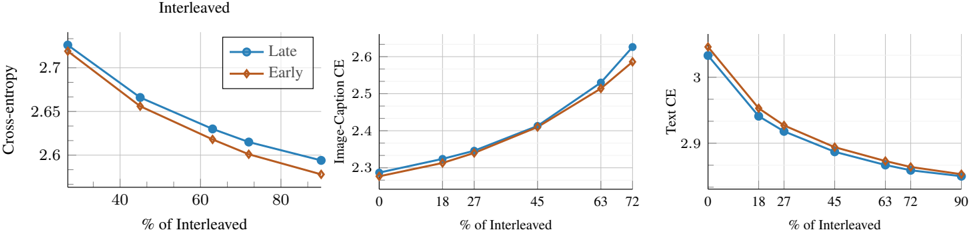
The image displays three horizontally arranged line charts under the main title "Interleaved." Each chart plots a different loss metric (y-axis) against the percentage of interleaved training data (x-axis). Two data series, labeled "Late" and "Early," are compared across all three charts. The charts illustrate how these metrics change as the proportion of interleaved data increases.
### Components/Axes
* **Main Title:** "Interleaved" (centered above the three charts).
* **Legend:** Located in the top-left corner of the first (leftmost) chart. It defines two series:
* **Late:** Represented by a blue line with circular markers.
* **Early:** Represented by an orange line with diamond markers.
* **Common X-Axis (All Charts):** Label: "% of Interleaved". The scale and tick marks differ per chart.
* **Individual Y-Axes:**
* **Left Chart:** Label: "Cross-entropy". Scale ranges from approximately 2.55 to 2.75.
* **Middle Chart:** Label: "Image-Caption CE". Scale ranges from approximately 2.3 to 2.65.
* **Right Chart:** Label: "Text CE". Scale ranges from approximately 2.85 to 3.05.
### Detailed Analysis
**1. Left Chart: Cross-entropy vs. % of Interleaved**
* **X-Axis Ticks:** 40, 60, 80. Data points appear at approximately 20%, 40%, 60%, 70%, and 90%.
* **Trend Verification:** Both the "Late" (blue circle) and "Early" (orange diamond) lines show a clear **downward slope**, indicating that Cross-entropy loss decreases as the percentage of interleaved data increases. The "Late" series is consistently slightly higher than the "Early" series.
* **Data Points (Approximate):**
* **~20%:** Late ≈ 2.73, Early ≈ 2.72
* **40%:** Late ≈ 2.67, Early ≈ 2.66
* **60%:** Late ≈ 2.63, Early ≈ 2.62
* **~70%:** Late ≈ 2.62, Early ≈ 2.60
* **~90%:** Late ≈ 2.59, Early ≈ 2.57
**2. Middle Chart: Image-Caption CE vs. % of Interleaved**
* **X-Axis Ticks:** 0, 18, 27, 45, 63, 72. Data points align with these ticks.
* **Trend Verification:** Both lines show a clear **upward slope**, indicating that Image-Caption Cross-Entropy loss increases as the percentage of interleaved data increases. The lines are very close initially but diverge slightly at higher percentages, with "Late" ending higher.
* **Data Points (Approximate):**
* **0%:** Late ≈ 2.29, Early ≈ 2.29
* **18%:** Late ≈ 2.32, Early ≈ 2.31
* **27%:** Late ≈ 2.34, Early ≈ 2.33
* **45%:** Late ≈ 2.42, Early ≈ 2.42
* **63%:** Late ≈ 2.53, Early ≈ 2.51
* **72%:** Late ≈ 2.62, Early ≈ 2.59
**3. Right Chart: Text CE vs. % of Interleaved**
* **X-Axis Ticks:** 0, 18, 27, 45, 63, 72, 90. Data points align with these ticks.
* **Trend Verification:** Both lines show a clear **downward slope**, indicating that Text Cross-Entropy loss decreases as the percentage of interleaved data increases. The "Early" (orange diamond) series is consistently slightly higher than the "Late" (blue circle) series.
* **Data Points (Approximate):**
* **0%:** Late ≈ 3.02, Early ≈ 3.04
* **18%:** Late ≈ 2.94, Early ≈ 2.96
* **27%:** Late ≈ 2.92, Early ≈ 2.93
* **45%:** Late ≈ 2.89, Early ≈ 2.90
* **63%:** Late ≈ 2.87, Early ≈ 2.88
* **72%:** Late ≈ 2.86, Early ≈ 2.87
* **90%:** Late ≈ 2.85, Early ≈ 2.86
### Key Observations
1. **Divergent Trends:** The most notable pattern is the opposing trends. Increasing the "% of Interleaved" data leads to **lower** overall Cross-entropy and Text CE, but **higher** Image-Caption CE.
2. **Consistent Series Relationship:** The relative performance of the "Late" and "Early" series is consistent within each metric but differs between metrics.
* For **Cross-entropy** and **Text CE**, "Early" (orange) performs slightly better (lower loss).
* For **Image-Caption CE**, "Late" (blue) performs worse (higher loss), especially at higher interleaving percentages.
3. **Magnitude of Change:** The increase in Image-Caption CE (from ~2.29 to ~2.62) is more pronounced than the decreases in the other two metrics over their respective ranges.
### Interpretation
The data suggests a trade-off in the training strategy. Increasing the proportion of interleaved data (likely mixing different data types or tasks during training) appears beneficial for the model's general cross-entropy loss and its specific performance on text-related tasks (Text CE). However, this comes at the cost of degraded performance on image-captioning tasks (Image-Caption CE).
This could indicate that interleaving helps the model learn general language representations more effectively but may dilute or interfere with the specialized learning required for aligning visual and textual features in image-captioning. The consistent, slight advantage of the "Early" strategy for text-based metrics versus its disadvantage for the vision-language metric suggests that the timing or method of interleaving ("Early" vs. "Late") has a nuanced, task-dependent impact. The charts collectively argue that the optimal "% of Interleaved" data is not a single value but depends on which task's performance is prioritized.