## Chart: Top-1 Accuracy vs. Representation Size
### Overview
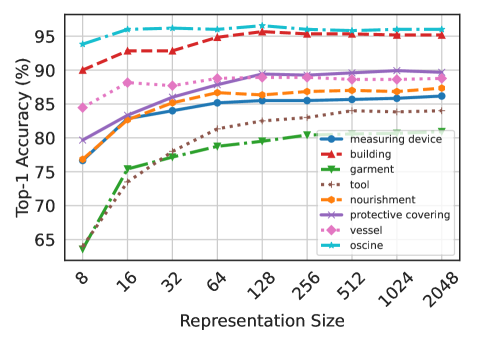
The image is a line chart comparing the Top-1 Accuracy (%) of different categories (measuring device, building, garment, tool, nourishment, protective covering, vessel, and oscine) against the Representation Size. The x-axis (Representation Size) is on a logarithmic scale, with values ranging from 8 to 2048. The y-axis (Top-1 Accuracy) ranges from 65% to 95%. Each category is represented by a distinct colored line with a unique marker.
### Components/Axes
* **Title:** Top-1 Accuracy (%) vs. Representation Size (implied)
* **X-axis:**
* Label: Representation Size
* Scale: Logarithmic, with values 8, 16, 32, 64, 128, 256, 512, 1024, 2048
* **Y-axis:**
* Label: Top-1 Accuracy (%)
* Scale: Linear, ranging from 65 to 95, with tick marks at intervals of 5 (65, 70, 75, 80, 85, 90, 95)
* **Legend:** Located in the bottom-right corner of the chart.
* measuring device (blue line with circle markers)
* building (red line with triangle markers)
* garment (green line with inverted triangle markers)
* tool (brown dotted line with plus markers)
* nourishment (orange line with no markers)
* protective covering (purple line with star markers)
* vessel (pink dotted line with diamond markers)
* oscine (cyan line with no markers)
### Detailed Analysis
* **measuring device (blue line with circle markers):** The accuracy starts at approximately 80% at a representation size of 8, increases to about 85% at 64, and then plateaus around 86-87% for larger representation sizes.
* (8, ~80%), (16, ~82%), (32, ~84%), (64, ~85%), (128, ~85.5%), (256, ~86%), (512, ~86%), (1024, ~86.5%), (2048, ~87%)
* **building (red line with triangle markers):** The accuracy starts at approximately 90% at a representation size of 8, increases to about 93% at 64, and then plateaus around 95-96% for larger representation sizes.
* (8, ~90%), (16, ~92%), (32, ~93%), (64, ~93%), (128, ~94%), (256, ~95%), (512, ~95%), (1024, ~95.5%), (2048, ~95.5%)
* **garment (green line with inverted triangle markers):** The accuracy starts at approximately 64% at a representation size of 8, increases to about 78% at 64, and then plateaus around 83-84% for larger representation sizes.
* (8, ~64%), (16, ~75%), (32, ~77%), (64, ~78%), (128, ~79%), (256, ~79%), (512, ~81%), (1024, ~83%), (2048, ~84%)
* **tool (brown dotted line with plus markers):** The accuracy starts at approximately 77% at a representation size of 8, increases to about 83% at 64, and then plateaus around 84% for larger representation sizes.
* (8, ~77%), (16, ~78%), (32, ~80%), (64, ~83%), (128, ~83%), (256, ~83%), (512, ~83.5%), (1024, ~84%), (2048, ~84%)
* **nourishment (orange line with no markers):** The accuracy starts at approximately 77% at a representation size of 8, increases to about 85% at 64, and then plateaus around 86% for larger representation sizes.
* (8, ~77%), (16, ~83%), (32, ~84%), (64, ~85%), (128, ~85.5%), (256, ~86%), (512, ~86%), (1024, ~86%), (2048, ~86%)
* **protective covering (purple line with star markers):** The accuracy starts at approximately 80% at a representation size of 8, increases to about 87% at 64, and then plateaus around 89-90% for larger representation sizes.
* (8, ~80%), (16, ~82%), (32, ~85%), (64, ~87%), (128, ~88%), (256, ~89%), (512, ~89%), (1024, ~89.5%), (2048, ~90%)
* **vessel (pink dotted line with diamond markers):** The accuracy starts at approximately 84% at a representation size of 8, increases to about 88% at 16, and then plateaus around 89-90% for larger representation sizes.
* (8, ~84%), (16, ~88%), (32, ~88%), (64, ~88%), (128, ~89%), (256, ~89%), (512, ~89%), (1024, ~89.5%), (2048, ~89.5%)
* **oscine (cyan line with no markers):** The accuracy starts at approximately 94% at a representation size of 8, increases to about 95% at 16, and then plateaus around 95-96% for larger representation sizes.
* (8, ~94%), (16, ~95%), (32, ~95%), (64, ~95%), (128, ~95.5%), (256, ~95.5%), (512, ~95.5%), (1024, ~95.5%), (2048, ~95.5%)
### Key Observations
* All categories show an increase in Top-1 Accuracy as the Representation Size increases from 8 to 64.
* Beyond a Representation Size of 64, the accuracy for most categories plateaus, indicating diminishing returns for larger representation sizes.
* "oscine" and "building" consistently exhibit the highest Top-1 Accuracy across all representation sizes.
* "garment" consistently exhibits the lowest Top-1 Accuracy across all representation sizes.
### Interpretation
The chart illustrates the relationship between representation size and the Top-1 Accuracy of different object categories. The initial increase in accuracy with increasing representation size suggests that larger representations allow the model to better distinguish and classify these objects. However, the plateauing effect observed for most categories indicates that there is a limit to the benefits of increasing representation size, possibly due to the model reaching its capacity to learn from the available data or the inherent complexity of the object categories themselves. The consistently high accuracy of "oscine" and "building" may indicate that these categories are easier to classify, while the lower accuracy of "garment" may suggest that this category is more complex or has greater intra-class variability.