## Line Chart: Top-1 Accuracy vs. Representation Size
### Overview
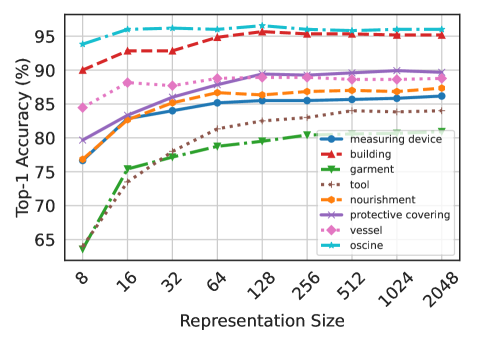
This line chart depicts the relationship between "Representation Size" and "Top-1 Accuracy" for several categories. The chart shows how the accuracy of identifying different object categories improves as the representation size increases. The chart has a grid background and a legend in the bottom-right corner.
### Components/Axes
* **X-axis:** "Representation Size" with values: 8, 16, 32, 64, 128, 256, 512, 1024, 2048.
* **Y-axis:** "Top-1 Accuracy (%)" with a scale ranging from approximately 65% to 96%.
* **Legend:** Located in the bottom-right corner, listing the following categories with corresponding colors:
* Measuring device (Green)
* Building (Red)
* Garment (Orange)
* Tool (Brown/Dashed)
* Nourishment (Blue)
* Protective covering (Purple)
* Vessel (Cyan/Dashed)
* Oscine (Teal)
### Detailed Analysis
Here's a breakdown of each line's trend and approximate data points, verified against the legend colors:
* **Measuring device (Green):** The line starts at approximately 66% accuracy at a representation size of 8, and increases rapidly to around 82% at a representation size of 32. It continues to increase, reaching approximately 92% at a representation size of 128, and plateaus around 93-94% for larger representation sizes.
* **Building (Red):** This line starts at approximately 77% accuracy at a representation size of 8, and increases steadily to around 93% at a representation size of 64. It then plateaus, remaining around 94-95% for larger representation sizes.
* **Garment (Orange):** The line begins at approximately 79% accuracy at a representation size of 8, and increases to around 88% at a representation size of 64. It continues to increase, reaching approximately 91% at a representation size of 256, and plateaus around 91-92% for larger representation sizes.
* **Tool (Brown/Dashed):** This line starts at approximately 72% accuracy at a representation size of 8, and increases gradually to around 80% at a representation size of 64. It continues to increase, reaching approximately 86% at a representation size of 512, and plateaus around 86-87% for larger representation sizes.
* **Nourishment (Blue):** The line starts at approximately 82% accuracy at a representation size of 8, and increases to around 86% at a representation size of 64. It then plateaus, remaining around 86-87% for larger representation sizes.
* **Protective covering (Purple):** This line starts at approximately 75% accuracy at a representation size of 8, and increases to around 88% at a representation size of 128. It continues to increase, reaching approximately 90% at a representation size of 256, and plateaus around 90-91% for larger representation sizes.
* **Vessel (Cyan/Dashed):** The line begins at approximately 80% accuracy at a representation size of 8, and increases to around 88% at a representation size of 64. It continues to increase, reaching approximately 90% at a representation size of 256, and plateaus around 90-91% for larger representation sizes.
* **Oscine (Teal):** The line starts at approximately 74% accuracy at a representation size of 8, and increases to around 84% at a representation size of 128. It continues to increase, reaching approximately 89% at a representation size of 512, and plateaus around 89-90% for larger representation sizes.
### Key Observations
* The "Building" category consistently exhibits the highest accuracy across all representation sizes.
* The "Measuring device" category shows the most significant improvement in accuracy with increasing representation size, particularly between 8 and 128.
* The accuracy of most categories plateaus after a representation size of 256, indicating diminishing returns from further increasing the representation size.
* The "Tool" and "Oscine" categories have the lowest overall accuracy compared to the other categories.
### Interpretation
The data suggests that increasing the representation size generally improves the accuracy of identifying these object categories. However, the rate of improvement diminishes as the representation size increases, and there is a point of diminishing returns. The varying accuracy levels across categories indicate that some objects are inherently easier to identify than others, potentially due to their visual distinctiveness or the quality of the training data. The plateauing effect suggests that the model has reached its capacity to extract useful information from the representation for these specific categories. This information could be used to optimize model training and resource allocation, focusing on categories with lower accuracy or exploring alternative representation techniques. The dashed lines for "Tool" and "Vessel" may indicate a different training methodology or data source compared to the solid lines.