TECHNICAL ASSET FINGERPRINT
4c9cd53b1cabcc3b754275c5
Click to view fullscreen
Press ESC or click to close
FOUND IN PAPERS
EXPERT: healer-alpha-free VERSION 1
RUNTIME: free/openrouter/healer-alpha
INTEL_VERIFIED
\n
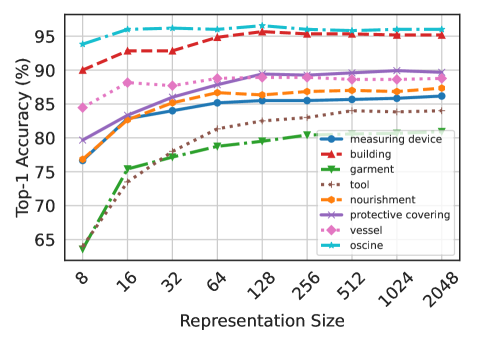
## Line Chart: Top-1 Accuracy vs. Representation Size for Various Object Categories
### Overview
The image is a line chart plotting the Top-1 Accuracy percentage against Representation Size for eight distinct object categories. The chart demonstrates how classification accuracy generally improves as the representation size increases, with performance varying significantly across categories.
### Components/Axes
* **Chart Type:** Multi-series line chart with markers.
* **X-Axis (Horizontal):**
* **Label:** "Representation Size"
* **Scale:** Logarithmic scale (base 2).
* **Tick Values:** 8, 16, 32, 64, 128, 256, 512, 1024, 2048.
* **Y-Axis (Vertical):**
* **Label:** "Top-1 Accuracy (%)"
* **Scale:** Linear scale.
* **Range:** Approximately 65% to 97%.
* **Tick Values:** 65, 70, 75, 80, 85, 90, 95.
* **Legend:**
* **Position:** Centered on the right side of the chart area.
* **Content:** Maps line colors and styles to eight categories.
* **Entries (from top to bottom as listed in legend):**
1. `measuring device` - Blue solid line with circle markers.
2. `building` - Red dashed line with square markers.
3. `garment` - Green dash-dot line with triangle-up markers.
4. `tool` - Brown dotted line with plus markers.
5. `nourishment` - Orange long-dash line with diamond markers.
6. `protective covering` - Purple solid line with star markers.
7. `vessel` - Pink dotted line with pentagon markers.
8. `oscine` - Cyan dash-dot line with triangle-down markers.
### Detailed Analysis
**Trend Verification & Data Point Extraction (Approximate Values):**
1. **`oscine` (Cyan, dash-dot, triangle-down):**
* **Trend:** Highest overall accuracy. Starts high and shows a very slight, steady increase, plateauing near the top.
* **Data Points:** ~94% (Size 8) → ~95% (16) → ~96% (32) → ~96% (64) → ~96.5% (128) → ~96% (256) → ~96% (512) → ~96% (1024) → ~96% (2048).
2. **`building` (Red, dashed, square):**
* **Trend:** Second highest accuracy. Shows a clear upward trend that plateaus after size 128.
* **Data Points:** ~90% (8) → ~93% (16) → ~93% (32) → ~95% (64) → ~95.5% (128) → ~95% (256) → ~95% (512) → ~95% (1024) → ~95% (2048).
3. **`vessel` (Pink, dotted, pentagon):**
* **Trend:** Starts moderately high, increases to a peak around size 128, then slightly declines.
* **Data Points:** ~85% (8) → ~88% (16) → ~88% (32) → ~89% (64) → ~89.5% (128) → ~89% (256) → ~89% (512) → ~89% (1024) → ~89% (2048).
4. **`protective covering` (Purple, solid, star):**
* **Trend:** Steady, consistent upward slope that flattens in the higher sizes.
* **Data Points:** ~80% (8) → ~84% (16) → ~86% (32) → ~88% (64) → ~89% (128) → ~89% (256) → ~89% (512) → ~89% (1024) → ~89% (2048).
5. **`nourishment` (Orange, long-dash, diamond):**
* **Trend:** Similar trajectory to `protective covering`, but consistently a few percentage points lower.
* **Data Points:** ~77% (8) → ~83% (16) → ~85% (32) → ~86% (64) → ~87% (128) → ~87% (256) → ~87% (512) → ~87% (1024) → ~87% (2048).
6. **`measuring device` (Blue, solid, circle):**
* **Trend:** Starts lower, shows a strong initial increase, then plateaus.
* **Data Points:** ~77% (8) → ~83% (16) → ~84% (32) → ~85% (64) → ~85.5% (128) → ~86% (256) → ~86% (512) → ~86% (1024) → ~86% (2048).
7. **`tool` (Brown, dotted, plus):**
* **Trend:** Starts the lowest but shows a very consistent, strong upward trend across the entire range, never fully plateauing.
* **Data Points:** ~64% (8) → ~73% (16) → ~77% (32) → ~80% (64) → ~82% (128) → ~83% (256) → ~84% (512) → ~84.5% (1024) → ~85% (2048).
8. **`garment` (Green, dash-dot, triangle-up):**
* **Trend:** Starts very low, increases rapidly until size 64, then the rate of improvement slows but continues upward.
* **Data Points:** ~64% (8) → ~76% (16) → ~77% (32) → ~78% (64) → ~80% (128) → ~81% (256) → ~82% (512) → ~83% (1024) → ~84% (2048).
### Key Observations
1. **Performance Hierarchy:** There is a clear and consistent performance hierarchy across all representation sizes. `oscine` and `building` are top performers, while `tool` and `garment` are the lowest performers, though they show the most dramatic improvement.
2. **Diminishing Returns:** All categories exhibit diminishing returns. The most significant accuracy gains occur between representation sizes 8 and 128. Beyond size 128, improvements are marginal or non-existent for most categories.
3. **Convergence:** The performance gap between categories narrows as representation size increases. At size 8, the spread is ~30 percentage points (94% vs. 64%). At size 2048, the spread is ~12 percentage points (96% vs. 84%).
4. **Outlier Trend:** The `tool` category is notable for its near-linear improvement on this log-scale chart, suggesting its accuracy benefits more consistently from increased representation size compared to others that plateau earlier.
### Interpretation
This chart illustrates a fundamental principle in machine learning and computer vision: model capacity (here proxied by "Representation Size") is crucial for performance, but its benefit is category-dependent.
* **What the data suggests:** The data demonstrates that larger representation sizes generally lead to higher classification accuracy. However, the "easiness" of the category dictates both the absolute performance and the rate of improvement. Categories like `oscine` (likely birds) and `building` may have more distinctive, learnable features, allowing high accuracy even with small representations. Conversely, categories like `tool` and `garment` may be more visually diverse or have subtler defining features, requiring larger representations to capture their complexity.
* **How elements relate:** The x-axis (model capacity) directly influences the y-axis (performance). The legend categories act as the independent variable being tested under this relationship. The plateauing curves indicate a saturation point where adding more capacity yields minimal benefit for a given task and dataset.
* **Notable implications:** The findings are critical for resource allocation in model design. For tasks focused on `oscine` or `building` classification, a smaller, more efficient model (size ~128) may suffice. For tasks involving `tool` or `garment` recognition, investing in a larger representation (size 1024+) is justified to achieve acceptable performance. The consistent hierarchy suggests inherent differences in the visual complexity or distinctiveness of these object categories within the dataset used.
DECODING INTELLIGENCE...