## Line Graph: Top-1 Accuracy (%) vs. Representation Size
### Overview
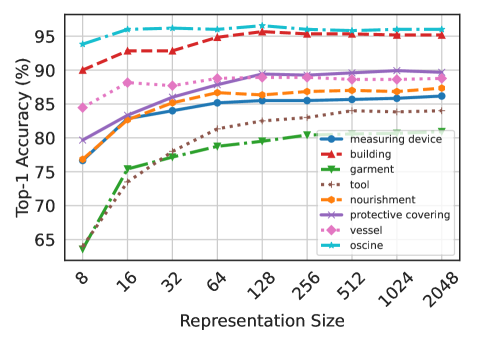
The image is a line graph comparing the top-1 accuracy (%) of various categories across different representation sizes (8 to 2048). The graph includes eight data series, each represented by a distinct color and marker. The x-axis (Representation Size) uses logarithmic scaling (powers of 2), while the y-axis (Top-1 Accuracy %) ranges from 65% to 95%.
### Components/Axes
- **X-axis (Representation Size)**: Logarithmic scale with values: 8, 16, 32, 64, 128, 256, 512, 1024, 2048.
- **Y-axis (Top-1 Accuracy %)**: Linear scale from 65% to 95%.
- **Legend**: Located in the bottom-right corner, mapping colors/markers to categories:
- Blue solid line with circles: Measuring device
- Red dashed line with triangles: Building
- Green dashed line with triangles: Garment
- Brown dotted line with crosses: Tool
- Orange dashed line with diamonds: Nourishment
- Purple solid line with stars: Protective covering
- Pink dotted line with diamonds: Vessel
- Teal solid line with stars: Oscine
### Detailed Analysis
1. **Measuring Device (Blue)**: Starts at ~94% (8), rises to ~95% (16), plateaus at ~96% (32–2048).
2. **Building (Red)**: Begins at ~90% (8), increases to ~95% (64), stabilizes at ~95% (128–2048).
3. **Garment (Green)**: Starts at ~65% (8), sharply rises to ~80% (64), then plateaus at ~85% (128–2048).
4. **Tool (Brown)**: Begins at ~70% (8), increases to ~85% (128), stabilizes at ~88% (256–2048).
5. **Nourishment (Orange)**: Starts at ~75% (8), rises to ~90% (2048), with steady growth across all sizes.
6. **Protective Covering (Purple)**: Begins at ~80% (8), increases to ~90% (128), plateaus at ~90% (256–2048).
7. **Vessel (Pink)**: Starts at ~85% (8), rises to ~90% (128), stabilizes at ~90% (256–2048).
8. **Oscine (Teal)**: Starts at ~95% (8), remains flat at ~95–96% (16–2048).
### Key Observations
- **Highest Performers**: Oscine (teal) and measuring device (blue) maintain the highest accuracy (~95–96%) across all sizes.
- **Most Improvement**: Garment (green) and tool (brown) show the steepest increases, starting at ~65% and ~70% (8) and reaching ~85% and ~88% (2048), respectively.
- **Stable Lines**: Building (red), protective covering (purple), and vessel (pink) exhibit minimal changes after ~64–128 representation size.
- **Gradual Growth**: Nourishment (orange) shows consistent improvement from ~75% to ~90% as representation size increases.
### Interpretation
The data suggests that **larger representation sizes generally improve top-1 accuracy** for most categories, with **garment** and **tool** benefiting the most from increased size. **Oscine** and **measuring device** demonstrate robustness, maintaining high accuracy regardless of representation size. This implies that certain categories (e.g., garment, tool) may require higher-resolution representations to achieve optimal performance, while others (e.g., oscine) are less sensitive to size variations. The stability of lines like building and protective covering indicates diminishing returns at larger sizes for these categories.