## Scatter Plot with Contour Distributions: General Text vs Medical Text
### Overview
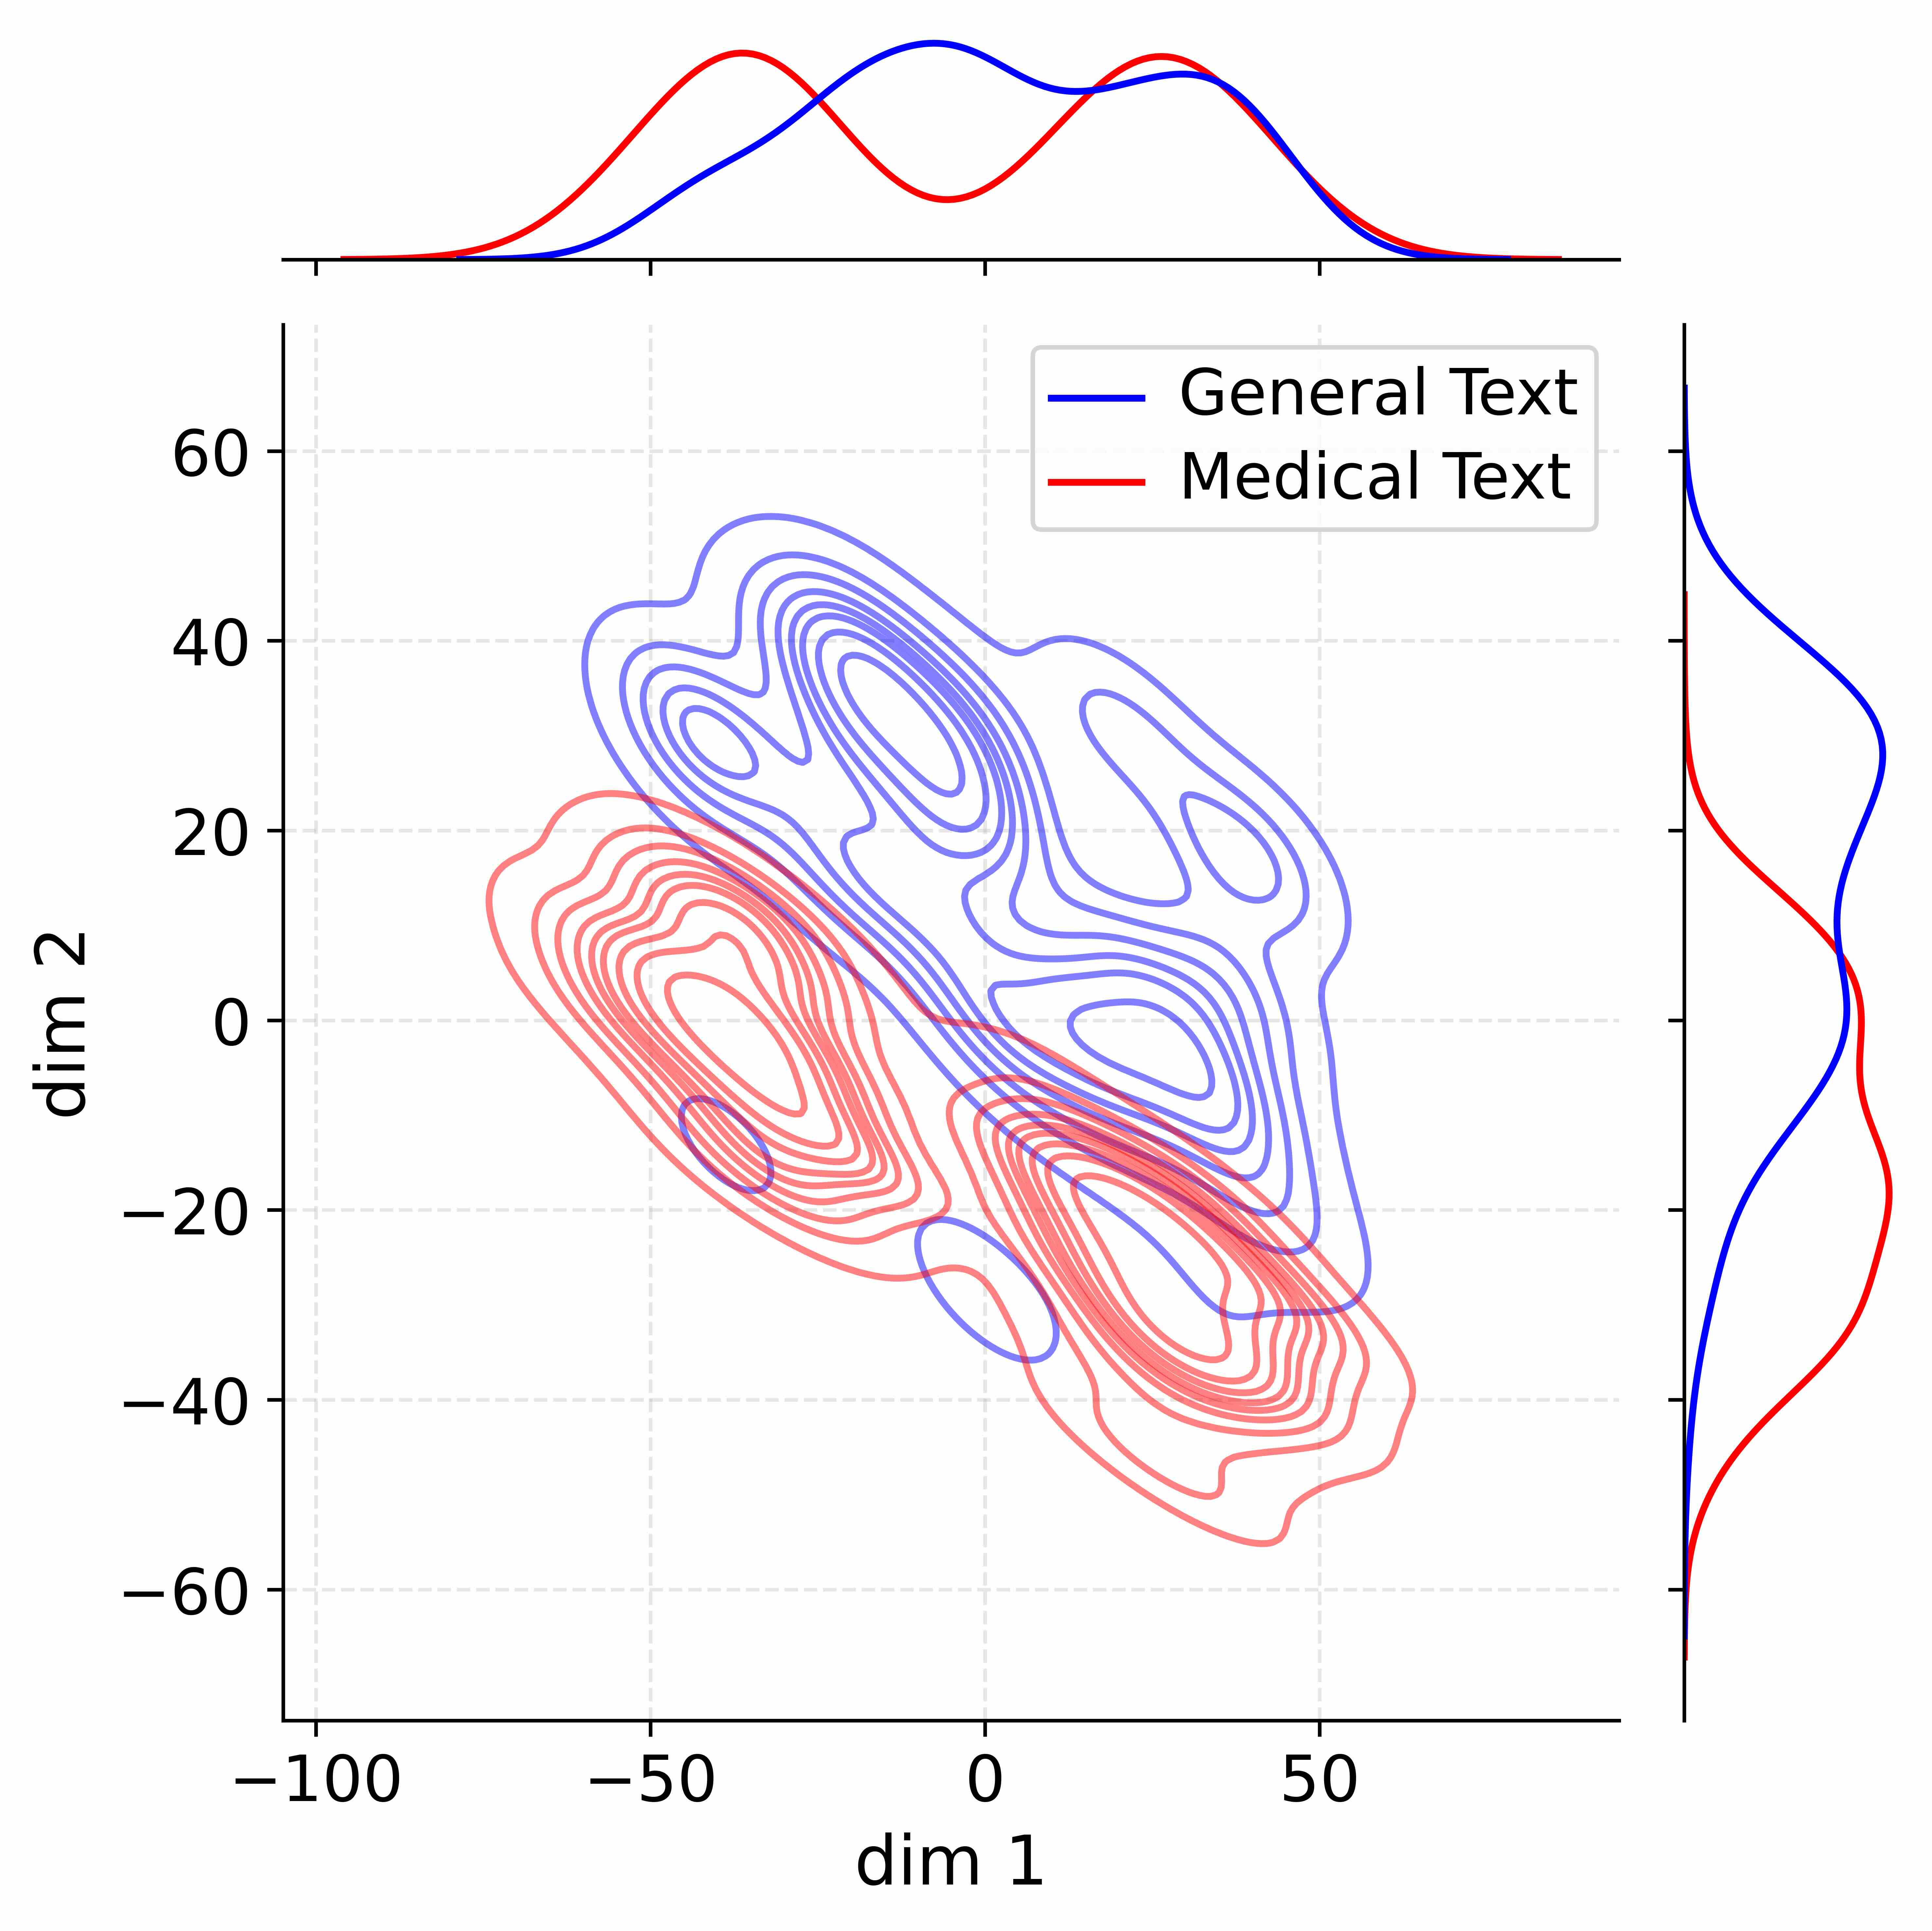
The image presents a 2D scatter plot with contour distributions comparing two text types: General Text (blue) and Medical Text (red). The plot includes marginal histograms on the top (dim 1) and right (dim 2), with overlapping contour regions in the central plot. The legend is positioned in the top-right corner.
---
### Components/Axes
- **X-axis (dim 1)**: Labeled "dim 1", ranges from -100 to 100 with gridlines at intervals of 20.
- **Y-axis (dim 2)**: Labeled "dim 2", ranges from -60 to 60 with gridlines at intervals of 20.
- **Legend**: Located in the top-right corner, with:
- **Blue**: General Text
- **Red**: Medical Text
- **Marginal Histograms**:
- **Top histogram (dim 1)**: Blue (General Text) peaks near -20, red (Medical Text) peaks near 20.
- **Right histogram (dim 2)**: Blue (General Text) peaks near 20, red (Medical Text) peaks near -20.
---
### Detailed Analysis
#### Main Plot (Contour Distributions)
- **General Text (Blue)**:
- Contours form an elongated, asymmetrical distribution centered roughly at **dim 1 ≈ -20, dim 2 ≈ 20**.
- Density decreases outward, with the innermost contour (highest density) at **dim 1 ≈ -30, dim 2 ≈ 30**.
- Spread: dim 1 spans -80 to 0, dim 2 spans 0 to 60.
- **Medical Text (Red)**:
- Contours form a distribution centered at **dim 1 ≈ 20, dim 2 ≈ -20**.
- Density decreases outward, with the innermost contour at **dim 1 ≈ 30, dim 2 ≈ -30**.
- Spread: dim 1 spans 0 to 100, dim 2 spans -60 to 0.
- **Overlap Region**: A small overlapping area exists near **dim 1 ≈ 0, dim 2 ≈ 0**, where both distributions intersect.
#### Marginal Histograms
- **Top Histogram (dim 1)**:
- Blue (General Text): Peaks at **dim 1 ≈ -20**, with a secondary peak near -40.
- Red (Medical Text): Peaks at **dim 1 ≈ 20**, with a secondary peak near 40.
- Both distributions have tails extending to the edges of the axis.
- **Right Histogram (dim 2)**:
- Blue (General Text): Peaks at **dim 2 ≈ 20**, with a secondary peak near 40.
- Red (Medical Text): Peaks at **dim 2 ≈ -20**, with a secondary peak near -40.
- Both distributions show symmetry around their peaks.
---
### Key Observations
1. **Distinct Distributions**: General Text and Medical Text occupy largely separate regions in the plot, with minimal overlap.
2. **Dimensional Separation**:
- General Text clusters in the **negative dim 1, positive dim 2** quadrant.
- Medical Text clusters in the **positive dim 1, negative dim 2** quadrant.
3. **Marginal Peaks**: Histograms confirm the central tendency of each distribution aligns with the contour centers.
4. **Overlap Ambiguity**: The small overlapping region near the origin suggests potential ambiguity in classifying some data points.
---
### Interpretation
The plot demonstrates that General Text and Medical Text exhibit distinct patterns in the first two dimensions of their feature space. The marginal histograms reinforce this separation, showing skewed distributions for each text type. The overlap near the origin indicates that some data points may share characteristics of both text types, possibly due to overlapping vocabulary or contextual usage. This could imply challenges in classification tasks where the two categories are not entirely disjoint. The wider spread of General Text in dim 1 and Medical Text in dim 2 suggests these dimensions capture unique variability in each category.