\n
## Heatmap: Array Pieces vs. Choices
### Overview
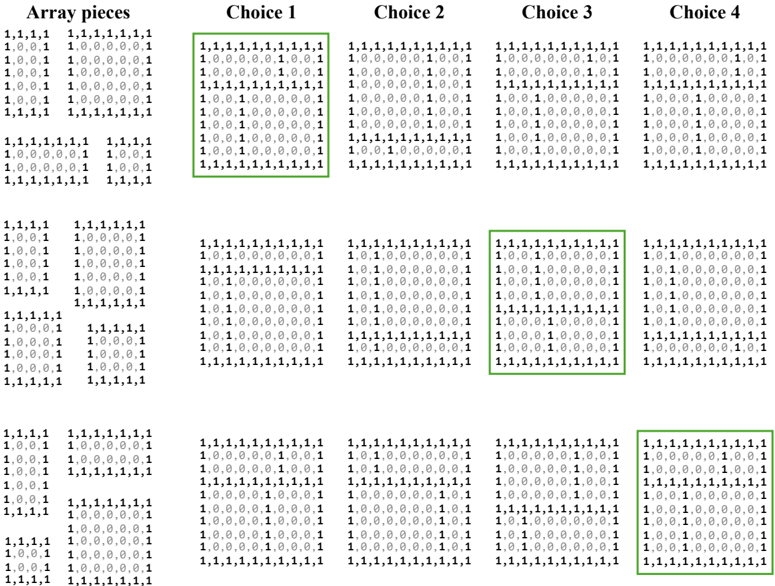
The image presents a heatmap comparing "Array pieces" against four "Choices" (Choice 1, Choice 2, Choice 3, and Choice 4). The heatmap uses a color gradient to represent the values within a 5x5 grid for each combination of array piece and choice. The values appear to be numerical, likely representing some form of score or probability. The color scale is not explicitly provided, but it appears to range from dark green (low value) to light green/white (high value).
### Components/Axes
* **X-axis:** Represents the four Choices: Choice 1, Choice 2, Choice 3, Choice 4.
* **Y-axis:** Represents the "Array pieces". There are 5 distinct array pieces, each repeated multiple times.
* **Cells:** Each cell in the grid represents the value for a specific array piece and choice combination.
* **Color Scale:** Implicitly ranges from dark green (low value) to light green/white (high value).
* **Highlighted Cells:** Several cells are highlighted with a green box, indicating specific points of interest.
### Detailed Analysis
The heatmap consists of four 5x5 grids, one for each choice. Each grid contains values represented by color intensity. The values within each cell appear to be either 0, 0.1, 0.6, or 1.
**Choice 1:**
* The majority of cells contain the value 1, represented by a light green/white color.
* There are a few cells with values of 0.6, 0.1, and 0.
* Highlighted cells: (Row 1, Col 1), (Row 3, Col 2), (Row 5, Col 3).
**Choice 2:**
* Similar to Choice 1, most cells contain the value 1.
* There are scattered cells with values of 0.6, 0.1, and 0.
* Highlighted cells: (Row 1, Col 1), (Row 3, Col 2), (Row 5, Col 3).
**Choice 3:**
* Again, the majority of cells contain the value 1.
* There are scattered cells with values of 0.6, 0.1, and 0.
* Highlighted cells: (Row 1, Col 1), (Row 3, Col 2), (Row 5, Col 3).
**Choice 4:**
* The majority of cells contain the value 1.
* There are scattered cells with values of 0.6, 0.1, and 0.
* Highlighted cells: (Row 1, Col 1), (Row 3, Col 2), (Row 5, Col 3).
The values within each grid are arranged as follows (reading row by row):
1,1,1,1,1
1,0,0,1,1
1,0,0,0,1
1,0,0,0,0
1,1,1,1,1
1,1,1,1,1
1,0,0,1,1
1,0,0,0,1
1,0,0,0,0
1,1,1,1,1
1,1,1,1,1
1,0,0,1,1
1,0,0,0,1
1,0,0,0,0
1,1,1,1,1
1,1,1,1,1
1,0,0,1,1
1,0,0,0,1
1,0,0,0,0
1,1,1,1,1
### Key Observations
* The value '1' dominates across all choices, suggesting a strong positive association for most array piece/choice combinations.
* The highlighted cells are consistent across all four choices, indicating that these specific array piece/choice combinations are of particular interest.
* The distribution of lower values (0, 0.1, 0.6) appears somewhat random within each grid.
* The array pieces are identical across all choices.
### Interpretation
The heatmap likely represents the suitability or compatibility of different "Array pieces" with each of the four "Choices". The high prevalence of '1' suggests that most array pieces are generally well-suited to all choices. The highlighted cells, which are consistent across all choices, may represent array piece/choice combinations that are particularly strong or important. The lower values (0, 0.1, 0.6) could indicate areas where the array piece and choice are less compatible or require further consideration.
The consistent pattern across the four choices suggests that the underlying relationship between array pieces and choices is relatively stable. The heatmap could be used to inform decision-making, for example, by prioritizing array pieces that consistently score highly across all choices. The highlighted cells could be used to identify optimal combinations or areas for further investigation.