## Diagram: Kepler Agent Workflow
### Overview
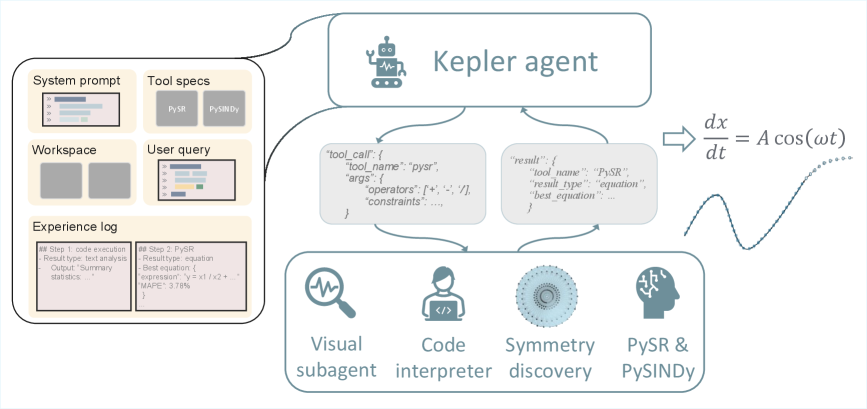
The image is a diagram illustrating the workflow of a "Kepler agent." It shows the agent's inputs, processing steps, and outputs, highlighting the tools and sub-agents involved in the process.
### Components/Axes
* **Kepler agent:** The central component, depicted as a robot icon, representing the AI agent.
* **Inputs (Left side):**
* **System prompt:** A placeholder showing lines of text.
* **Tool specs:** Labeled "PySR" and "PySINDy".
* **Workspace:** Two empty boxes.
* **User query:** A placeholder showing a bar chart.
* **Experience log:** Two entries:
* Step 1: Code execution, Result type: text analysis, Output: "Summary statistics..."
* Step 2: PySR, Result type: equation, Best equation: {"expression": "y = x1 / x2 + ...", "MAPE": 3.78%}
* **Processing Steps (Center):**
* **Tool Call:** A JSON-like structure: {"tool_name": "pysr", "args": {"operators": ['+', '-', '*', '/'], "constraints": ....}}
* **Result:** A JSON-like structure: {"tool_name": "PySR", "result_type": "equation", "best_equation": ...}
* **Sub-agents (Bottom):**
* **Visual subagent:** Depicted with a magnifying glass icon.
* **Code interpreter:** Depicted with a person icon and code tags.
* **Symmetry discovery:** Depicted with a circular pattern.
* **PySR & PySINDy:** Depicted with a brain icon.
* **Output (Right side):**
* Equation: dx/dt = A cos(ωt)
* A sine wave graph.
### Detailed Analysis or ### Content Details
* **Input Details:**
* The "System prompt," "Workspace," and "User query" are represented by placeholder images, suggesting they are variable inputs.
* The "Experience log" shows a history of the agent's actions and results, including the tool used (PySR), the type of analysis performed (text analysis, equation), and the output (summary statistics, best equation).
* **Processing Details:**
* The "Tool Call" specifies the tool to be used (PySR), the arguments to be passed to the tool (operators), and any constraints.
* The "Result" contains the tool name, the result type (equation), and the best equation found.
* **Sub-agent Details:**
* The sub-agents represent different modules or components of the Kepler agent, each responsible for a specific task.
* The "Visual subagent" likely handles visual data processing.
* The "Code interpreter" likely executes code.
* The "Symmetry discovery" likely identifies symmetries in the data.
* "PySR & PySINDy" are likely algorithms for symbolic regression and system identification.
* **Output Details:**
* The output is an equation (dx/dt = A cos(ωt)) and a corresponding sine wave graph, suggesting that the Kepler agent is capable of discovering and representing mathematical relationships in data.
### Key Observations
* The diagram shows a clear flow of information from inputs to processing steps to outputs.
* The Kepler agent utilizes a variety of tools and sub-agents to perform its tasks.
* The agent is capable of discovering and representing mathematical relationships in data.
### Interpretation
The diagram illustrates the architecture and workflow of the Kepler agent, a system designed to automatically discover and represent mathematical relationships in data. The agent takes in various inputs, including system prompts, tool specifications, workspace data, user queries, and experience logs. It then uses a combination of tools and sub-agents to process the data, identify patterns, and generate mathematical equations. The output is a mathematical equation and a corresponding graph, representing the discovered relationship.
The diagram highlights the modularity and flexibility of the Kepler agent, as it can utilize a variety of tools and sub-agents to perform its tasks. The agent's ability to learn from its experience, as indicated by the "Experience log," suggests that it can improve its performance over time. The Kepler agent has the potential to be a valuable tool for scientists and engineers who need to analyze complex data and discover underlying mathematical relationships.