\n
## Diagram: Kepler Agent Architecture
### Overview
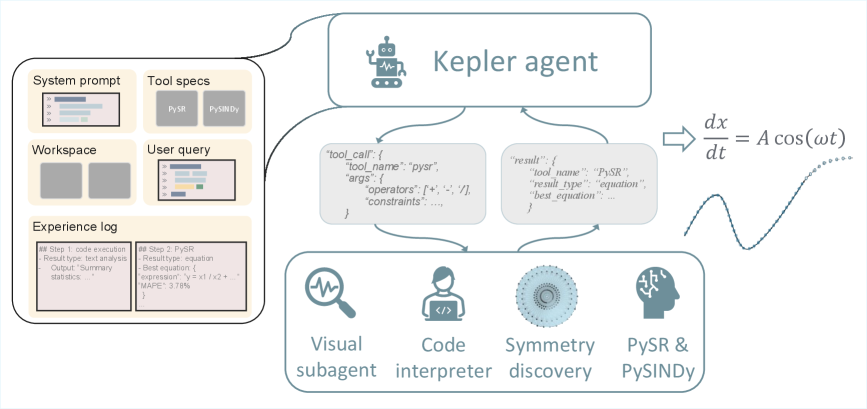
The image is a diagram illustrating the architecture of a "Kepler agent," a system designed for problem-solving, likely in a scientific or mathematical context. The diagram depicts the flow of information and interaction between various components, including system prompts, tools, a workspace, an experience log, and sub-agents. It highlights a process involving tool calls, results, and a final equation output.
### Components/Axes
The diagram is structured around a central "Kepler agent" block. Key components include:
* **System prompt:** Represented by a vertical bar chart.
* **Tool specs:** Listed as "PySR" and "PySINDy".
* **Workspace:** Depicted as a grid of rectangles.
* **User query:** Shown as a text input field.
* **Experience log:** Displayed as a list of steps with details.
* **Tool call:** A JSON-like structure labeled "tool\_call".
* **Result:** A JSON-like structure labeled "result".
* **Equation:** `dx/dt = A cos(ωt)`
* **Sub-agents:** Visual subagent, Code interpreter, Symmetry discovery, PySR & PySINDy.
Arrows indicate the direction of information flow between these components.
### Detailed Analysis or Content Details
The diagram shows the following flow:
1. **Input:** A System prompt and User query initiate the process.
2. **Tool Selection:** The system utilizes Tool specs (PySR and PySINDy).
3. **Tool Call:** The system generates a "tool\_call" with the following structure:
```json
{
"tool_name": "pysr",
"args": {
"operators": "{+, - ,/}",
"constraints": ""
}
}
```
4. **Result:** The tool returns a "result" with the following structure:
```json
{
"tool_name": "PySR",
"result_type": "equation",
"best_equation": ""
}
```
5. **Equation Output:** The system outputs the equation `dx/dt = A cos(ωt)`.
6. **Sub-agent Interaction:** The Kepler agent interacts with four sub-agents: Visual subagent, Code interpreter, Symmetry discovery, and PySR & PySINDy.
The Experience log shows two steps:
* **Step 1:** Code execution, Result type: text analysis, Output: Summary statistics.
* **Step 2:** PySR, Result type: equation, Best equation: `y = x1 / x2 + ...`, MAPE: 3.78%.
### Key Observations
* The diagram emphasizes an iterative process of tool calls and result analysis.
* The "Experience log" suggests the system learns and refines its approach over multiple steps.
* The final equation output indicates the system is capable of symbolic regression or equation discovery.
* The MAPE (Mean Absolute Percentage Error) of 3.78% in Step 2 suggests a relatively accurate model.
* The diagram does not provide numerical data beyond the MAPE value.
### Interpretation
The diagram illustrates a sophisticated agent-based system for scientific discovery. The Kepler agent leverages a combination of tools (PySR, PySINDy) and sub-agents to solve problems, likely involving data analysis and equation modeling. The system's ability to generate equations from data, as demonstrated by the `dx/dt = A cos(ωt)` output, suggests it can perform symbolic regression. The experience log indicates a learning component, where the agent refines its models based on previous results. The flow of information from system prompt and user query, through tool calls and results, to the final equation output, highlights a closed-loop system designed for automated scientific exploration. The inclusion of a visual subagent suggests the system can also process and interpret visual data. The diagram is a high-level architectural overview and does not provide details on the specific algorithms or implementation details of each component.