## Bar Chart: Difficulty levels in the MATH-500 split we use
### Overview
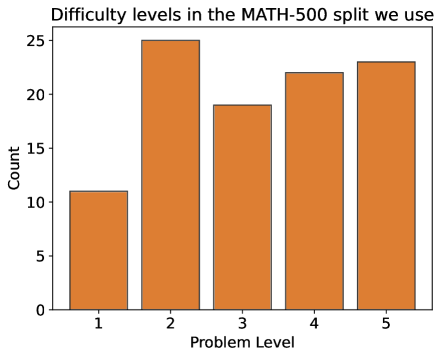
The chart visualizes the distribution of problem difficulty levels in the MATH-500 dataset. It uses vertical orange bars to represent counts of problems across five difficulty levels (1–5). The y-axis measures frequency (Count), while the x-axis categorizes problems by difficulty.
### Components/Axes
- **Title**: "Difficulty levels in the MATH-500 split we use" (top-center, black text).
- **X-axis**: Labeled "Problem Level" (bottom, black text). Categories: 1, 2, 3, 4, 5 (equally spaced).
- **Y-axis**: Labeled "Count" (left, black text). Scale: 0–25 in increments of 5.
- **Bars**: Five vertical orange bars, one per difficulty level. No legend present.
- **Gridlines**: Horizontal gridlines at y-axis increments (0, 5, 10, ..., 25).
### Detailed Analysis
- **Problem Level 1**: Bar height ≈10 (lowest count).
- **Problem Level 2**: Bar height ≈25 (peak count).
- **Problem Level 3**: Bar height ≈19 (moderate count).
- **Problem Level 4**: Bar height ≈22 (high count).
- **Problem Level 5**: Bar height ≈23 (highest count after Level 2).
### Key Observations
1. **Peak at Level 2**: The highest frequency (25) occurs at Level 2, suggesting it is the most common difficulty in the dataset.
2. **Dip at Level 3**: A noticeable drop to 19 at Level 3, indicating fewer problems at this level compared to Levels 2, 4, and 5.
3. **High Frequencies at Levels 4–5**: Levels 4 and 5 have counts of 22 and 23, respectively, showing a concentration of harder problems.
4. **Low Frequency at Level 1**: Only 10 problems at Level 1, the lowest count, implying it is the least represented difficulty.
### Interpretation
The data suggests an uneven distribution of difficulty levels in the MATH-500 split. The dominance of Level 2 problems (25) may indicate a focus on intermediate difficulty, while the scarcity of Level 1 problems (10) could reflect either easier problems being underrepresented or a design choice to prioritize harder challenges. The dip at Level 3 might imply these problems are either less frequent or intentionally balanced against other levels. The high counts at Levels 4 and 5 (22–23) highlight a strong emphasis on advanced problems, which could impact the dataset's utility for training models on varying difficulty tiers. The absence of a legend simplifies interpretation but limits contextual clarity about the difficulty criteria used.