## Bar Chart: Difficulty Levels in MATH-500 Split
### Overview
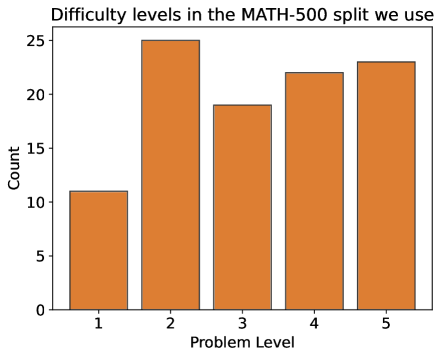
The image is a bar chart illustrating the distribution of difficulty levels in the MATH-500 split. The x-axis represents the problem level (ranging from 1 to 5), and the y-axis represents the count of problems at each difficulty level. The bars are all the same color, a shade of orange.
### Components/Axes
* **Title:** "Difficulty levels in the MATH-500 split we use"
* **X-axis:** "Problem Level" with markers at 1, 2, 3, 4, and 5.
* **Y-axis:** "Count" with markers at 0, 5, 10, 15, 20, and 25.
* **Bars:** Represent the count for each problem level. All bars are orange with black outlines.
### Detailed Analysis
* **Problem Level 1:** The bar extends to approximately 11 on the y-axis.
* **Problem Level 2:** The bar extends to approximately 25 on the y-axis.
* **Problem Level 3:** The bar extends to approximately 19 on the y-axis.
* **Problem Level 4:** The bar extends to approximately 22 on the y-axis.
* **Problem Level 5:** The bar extends to approximately 23 on the y-axis.
### Key Observations
* Problem Level 2 has the highest count, significantly higher than the other levels.
* Problem Level 1 has the lowest count.
* Problem Levels 4 and 5 have similar counts.
### Interpretation
The bar chart indicates that in the MATH-500 split, problems with difficulty level 2 are the most frequent, while problems with difficulty level 1 are the least frequent. The distribution suggests a non-uniform spread of difficulty levels, with a concentration around level 2. The data implies that the MATH-500 split may be skewed towards moderately difficult problems.