## Heatmap: Classification accuracies
### Overview
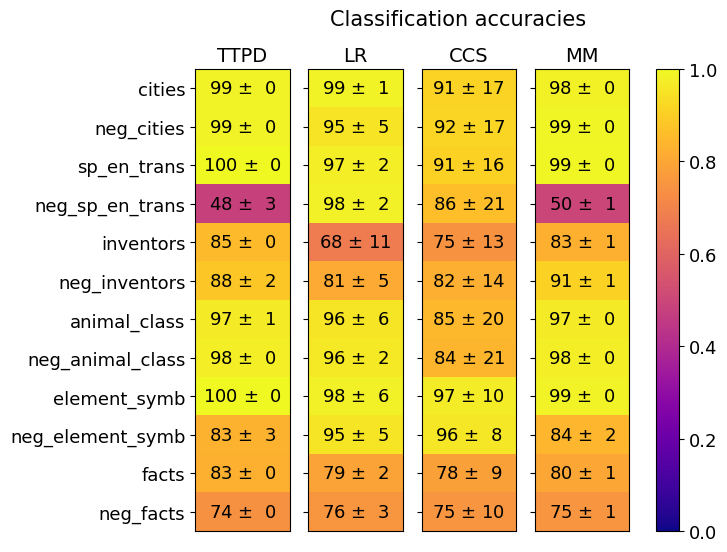
The image is a heatmap displaying classification accuracies for different models (TTPD, LR, CCS, MM) across various categories (cities, neg_cities, etc.). The heatmap uses a color gradient from dark blue (0.0) to bright yellow (1.0) to represent the accuracy values. Each cell contains the accuracy value and its associated uncertainty (± value).
### Components/Axes
* **Title:** Classification accuracies
* **Columns (Models):** TTPD, LR, CCS, MM
* **Rows (Categories):** cities, neg\_cities, sp\_en\_trans, neg\_sp\_en\_trans, inventors, neg\_inventors, animal\_class, neg\_animal\_class, element\_symb, neg\_element\_symb, facts, neg\_facts
* **Colorbar:** Ranges from 0.0 (dark blue) to 1.0 (bright yellow), representing the classification accuracy.
* **Values:** Each cell contains a numerical value representing the classification accuracy, along with an uncertainty value (e.g., 99 ± 0).
### Detailed Analysis
Here's a breakdown of the data for each category and model:
* **cities:**
* TTPD: 99 ± 0 (Yellow)
* LR: 99 ± 1 (Yellow)
* CCS: 91 ± 17 (Yellow)
* MM: 98 ± 0 (Yellow)
* **neg\_cities:**
* TTPD: 99 ± 0 (Yellow)
* LR: 95 ± 5 (Yellow)
* CCS: 92 ± 17 (Yellow)
* MM: 99 ± 0 (Yellow)
* **sp\_en\_trans:**
* TTPD: 100 ± 0 (Yellow)
* LR: 97 ± 2 (Yellow)
* CCS: 91 ± 16 (Yellow)
* MM: 99 ± 0 (Yellow)
* **neg\_sp\_en\_trans:**
* TTPD: 48 ± 3 (Purple)
* LR: 98 ± 2 (Yellow)
* CCS: 86 ± 21 (Yellow)
* MM: 50 ± 1 (Purple)
* **inventors:**
* TTPD: 85 ± 0 (Yellow)
* LR: 68 ± 11 (Orange)
* CCS: 75 ± 13 (Orange)
* MM: 83 ± 1 (Yellow)
* **neg\_inventors:**
* TTPD: 88 ± 2 (Yellow)
* LR: 81 ± 5 (Orange)
* CCS: 82 ± 14 (Orange)
* MM: 91 ± 1 (Yellow)
* **animal\_class:**
* TTPD: 97 ± 1 (Yellow)
* LR: 96 ± 6 (Yellow)
* CCS: 85 ± 20 (Yellow)
* MM: 97 ± 0 (Yellow)
* **neg\_animal\_class:**
* TTPD: 98 ± 0 (Yellow)
* LR: 96 ± 2 (Yellow)
* CCS: 84 ± 21 (Yellow)
* MM: 98 ± 0 (Yellow)
* **element\_symb:**
* TTPD: 100 ± 0 (Yellow)
* LR: 98 ± 6 (Yellow)
* CCS: 97 ± 10 (Yellow)
* MM: 99 ± 0 (Yellow)
* **neg\_element\_symb:**
* TTPD: 83 ± 3 (Yellow)
* LR: 95 ± 5 (Yellow)
* CCS: 96 ± 8 (Yellow)
* MM: 84 ± 2 (Yellow)
* **facts:**
* TTPD: 83 ± 0 (Orange)
* LR: 79 ± 2 (Orange)
* CCS: 78 ± 9 (Orange)
* MM: 80 ± 1 (Orange)
* **neg\_facts:**
* TTPD: 74 ± 0 (Orange)
* LR: 76 ± 3 (Orange)
* CCS: 75 ± 10 (Orange)
* MM: 75 ± 1 (Orange)
### Key Observations
* TTPD and MM models generally show high accuracy across most categories.
* LR and CCS models have lower accuracies and higher uncertainties in some categories, particularly "inventors", "neg_inventors", "facts", and "neg_facts".
* The "neg\_sp\_en\_trans" category shows significantly lower accuracy for TTPD and MM compared to LR and CCS.
### Interpretation
The heatmap visualizes the performance of different classification models on various categories. The high accuracy values (yellow) indicate good performance, while lower values (orange/purple) suggest areas where the models struggle. The uncertainties (± values) provide a measure of the variability in the model's performance.
The "neg\_sp\_en\_trans" category is a notable outlier, with TTPD and MM performing poorly compared to LR and CCS. This suggests that these models may have difficulty with negative examples of "sp\_en\_trans". The "inventors", "neg_inventors", "facts", and "neg_facts" categories also show relatively lower accuracies for LR and CCS, indicating potential challenges in these areas.
Overall, the heatmap provides a concise overview of the strengths and weaknesses of each model across different categories, allowing for targeted improvements and model selection based on the specific application.