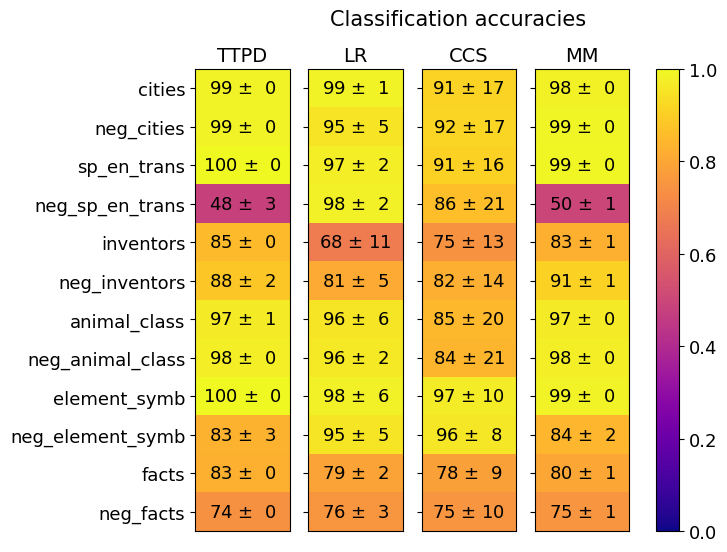
## Heatmap Chart: Classification Accuracies
### Overview
This image is a heatmap visualization titled "Classification accuracies." It displays the performance (accuracy scores) of four different classification methods across twelve distinct datasets or tasks. The performance is represented by both numerical values (mean accuracy ± standard deviation) and a color gradient, where brighter yellow indicates higher accuracy (closer to 1.0) and darker purple indicates lower accuracy (closer to 0.0).
### Components/Axes
* **Title:** "Classification accuracies" (centered at the top).
* **X-axis (Top):** Lists four classification methods.
* Labels (from left to right): `TTPD`, `LR`, `CCS`, `MM`.
* **Y-axis (Left):** Lists twelve datasets or tasks.
* Labels (from top to bottom): `cities`, `neg_cities`, `sp_en_trans`, `neg_sp_en_trans`, `inventors`, `neg_inventors`, `animal_class`, `neg_animal_class`, `element_symb`, `neg_element_symb`, `facts`, `neg_facts`.
* **Color Scale/Legend (Right):** A vertical bar showing the mapping from color to accuracy value.
* Scale ranges from `0.0` (dark purple) at the bottom to `1.0` (bright yellow) at the top.
* Major tick marks are at `0.0`, `0.2`, `0.4`, `0.6`, `0.8`, and `1.0`.
* **Data Cells:** A 12-row by 4-column grid. Each cell contains a mean accuracy value followed by "±" and a standard deviation value. The cell's background color corresponds to the mean accuracy on the color scale.
### Detailed Analysis
The following table reconstructs the data from the heatmap. Values are presented as Mean Accuracy ± Standard Deviation.
| Dataset / Task | TTPD | LR | CCS | MM |
| :--- | :--- | :--- | :--- | :--- |
| **cities** | 99 ± 0 | 99 ± 1 | 91 ± 17 | 98 ± 0 |
| **neg_cities** | 99 ± 0 | 95 ± 5 | 92 ± 17 | 99 ± 0 |
| **sp_en_trans** | 100 ± 0 | 97 ± 2 | 91 ± 16 | 99 ± 0 |
| **neg_sp_en_trans** | 48 ± 3 | 98 ± 2 | 86 ± 21 | 50 ± 1 |
| **inventors** | 85 ± 0 | 68 ± 11 | 75 ± 13 | 83 ± 1 |
| **neg_inventors** | 88 ± 2 | 81 ± 5 | 82 ± 14 | 91 ± 1 |
| **animal_class** | 97 ± 1 | 96 ± 6 | 85 ± 20 | 97 ± 0 |
| **neg_animal_class** | 98 ± 0 | 96 ± 2 | 84 ± 21 | 98 ± 0 |
| **element_symb** | 100 ± 0 | 98 ± 6 | 97 ± 10 | 99 ± 0 |
| **neg_element_symb** | 83 ± 3 | 95 ± 5 | 96 ± 8 | 84 ± 2 |
| **facts** | 83 ± 0 | 79 ± 2 | 78 ± 9 | 80 ± 1 |
| **neg_facts** | 74 ± 0 | 76 ± 3 | 75 ± 10 | 75 ± 1 |
**Trend Verification by Method:**
* **TTPD:** Shows very high accuracy (95-100%) on most tasks, with a dramatic drop on `neg_sp_en_trans` (48%). Generally low standard deviations (0-3).
* **LR:** Performance is more variable. It excels on `neg_sp_en_trans` (98%) but has its lowest score on `inventors` (68%). Standard deviations are moderate (1-11).
* **CCS:** Consistently shows the highest standard deviations (8-21), indicating high variance in its performance across runs or folds. Its mean accuracies are generally lower than TTPD and MM, except on `neg_element_symb`.
* **MM:** Performance is very similar to TTPD, with high accuracy on most tasks and a similar sharp drop on `neg_sp_en_trans` (50%). Standard deviations are very low (0-2).
### Key Observations
1. **The `neg_sp_en_trans` Anomaly:** This task shows a severe performance drop for both TTPD (48%) and MM (50%), while LR (98%) and CCS (86%) perform well. This is the most striking outlier in the chart.
2. **Method Grouping:** TTPD and MM exhibit nearly identical performance patterns across all tasks. Similarly, LR and CCS form a second, more variable group.
3. **Stability vs. Variance:** TTPD and MM are highly stable (low standard deviation). CCS is highly unstable (high standard deviation). LR is in between.
4. **Task Difficulty:** The `inventors` and `facts`/`neg_facts` tasks appear to be more challenging for all methods, with no method achieving above 88% on them. The `element_symb` and `animal_class` tasks appear to be the easiest.
### Interpretation
This heatmap provides a comparative benchmark of four classification methods. The data suggests that **TTPD and MM are the top-performing and most reliable methods** for the majority of these tasks, achieving near-perfect accuracy with high consistency. Their identical failure mode on `neg_sp_en_trans` suggests they may share a similar underlying mechanism or vulnerability.
The **`neg_sp_en_trans` task is a critical differentiator**. The fact that LR and CCS handle it well while TTPD and MM fail catastrophically implies a fundamental difference in how these method groups process this specific type of data (likely involving negation in Spanish-English translation). This could be a key insight for model selection depending on the application domain.
The **high variance of CCS** makes it a risky choice despite occasionally competitive mean scores (e.g., on `neg_element_symb`). LR offers a middle ground, with decent performance on the challenging `neg_sp_en_trans` task but lower scores elsewhere.
Overall, the chart effectively communicates that method choice is highly task-dependent. While TTPD/MM are generally superior, a user working specifically with negated translation data would be strongly advised to consider LR or CCS instead. The visualization successfully uses color and precise numerical annotation to highlight both general trends and critical exceptions.