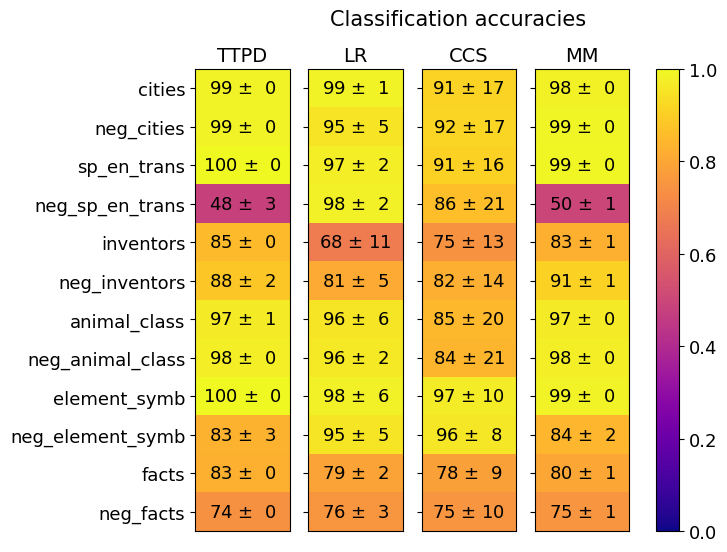
## Heatmap: Classification Accuracies
### Overview
The image is a heatmap visualizing classification accuracies across four models (TTPD, LR, CCS, MM) for 12 categories. The color gradient ranges from purple (low accuracy) to yellow (high accuracy), with numerical values and standard deviations provided for each cell. The legend on the right maps colors to accuracy values (0.0–1.0).
---
### Components/Axes
- **X-axis (Columns)**: Models labeled as TTPD, LR, CCS, MM.
- **Y-axis (Rows)**: Categories:
- cities
- neg_cities
- sp_en_trans
- neg_sp_en_trans
- inventors
- neg_inventors
- animal_class
- neg_animal_class
- element_symbol
- neg_element_symbol
- facts
- neg_facts
- **Legend**: Color gradient from purple (0.0) to yellow (1.0), with intermediate values (0.2, 0.4, 0.6, 0.8).
- **Textual Labels**: All category and model names are explicitly labeled in black text.
---
### Detailed Analysis
#### Model Performance by Category
1. **TTPD**:
- **High Accuracy**:
- cities (99 ± 0)
- neg_cities (99 ± 0)
- sp_en_trans (100 ± 0)
- element_symbol (100 ± 0)
- **Low Accuracy**:
- neg_sp_en_trans (48 ± 3)
- neg_facts (74 ± 0)
- **Moderate Accuracy**:
- inventors (85 ± 0)
- neg_inventors (88 ± 2)
- animal_class (97 ± 1)
- neg_animal_class (98 ± 0)
- facts (83 ± 0)
2. **LR**:
- **High Accuracy**:
- cities (99 ± 1)
- neg_cities (95 ± 5)
- sp_en_trans (97 ± 2)
- element_symbol (98 ± 6)
- **Moderate Accuracy**:
- neg_sp_en_trans (98 ± 2)
- inventors (68 ± 11)
- neg_inventors (81 ± 5)
- animal_class (96 ± 6)
- neg_animal_class (96 ± 2)
- facts (79 ± 2)
- **Low Accuracy**:
- neg_facts (76 ± 3)
3. **CCS**:
- **High Accuracy**:
- cities (91 ± 17)
- neg_cities (92 ± 17)
- sp_en_trans (91 ± 16)
- element_symbol (97 ± 10)
- **Moderate Accuracy**:
- neg_sp_en_trans (86 ± 21)
- inventors (75 ± 13)
- neg_inventors (82 ± 14)
- animal_class (85 ± 20)
- neg_animal_class (84 ± 21)
- facts (78 ± 9)
- **Low Accuracy**:
- neg_facts (75 ± 10)
4. **MM**:
- **High Accuracy**:
- cities (98 ± 0)
- neg_cities (99 ± 0)
- sp_en_trans (99 ± 0)
- element_symbol (99 ± 0)
- **Moderate Accuracy**:
- neg_sp_en_trans (50 ± 1)
- inventors (83 ± 1)
- neg_inventors (91 ± 1)
- animal_class (97 ± 0)
- neg_animal_class (98 ± 0)
- facts (80 ± 1)
- **Low Accuracy**:
- neg_facts (75 ± 1)
---
### Key Observations
1. **TTPD** excels in **sp_en_trans** (100%) and **element_symbol** (100%) but struggles with **neg_sp_en_trans** (48%) and **neg_facts** (74%).
2. **LR** shows variability in **inventors** (68%) and **neg_inventors** (81%), with moderate performance in **neg_facts** (76%).
3. **CCS** has the lowest accuracy in **neg_facts** (75%) and **neg_sp_en_trans** (86%), with higher variability (e.g., ±17 for cities).
4. **MM** performs consistently well across most categories, except **neg_sp_en_trans** (50%) and **neg_facts** (75%).
5. **Standard deviations** are generally small (≤5), indicating stable performance across models.
---
### Interpretation
- **Model Strengths**:
- TTPD and MM dominate in **sp_en_trans** and **element_symbol**, suggesting robustness in technical or symbolic tasks.
- MM’s near-perfect accuracy in **cities** (98%) and **neg_cities** (99%) highlights its reliability in geographical classification.
- **Weaknesses**:
- **neg_sp_en_trans** is a critical failure point for TTPD (48%) and MM (50%), indicating potential issues with negative or ambiguous translations.
- **CCS** underperforms in **neg_facts** (75%) and **neg_sp_en_trans** (86%), suggesting challenges with negative or complex factual data.
- **Color Correlation**:
- Yellow cells (high accuracy) align with the legend’s upper range (0.8–1.0), while purple cells (low accuracy) match the lower range (0.0–0.4).
- **Trends**:
- All models perform best on **positive categories** (e.g., cities, sp_en_trans) and struggle with **negative categories** (e.g., neg_sp_en_trans, neg_facts), possibly due to data imbalance or model bias.
---
### Spatial Grounding
- **Legend**: Positioned on the right, with a vertical gradient from purple (bottom) to yellow (top).
- **Data Points**: Each cell’s color matches the legend’s gradient, with numerical values overlaid in black text.
- **Axis Labels**: Categories (Y-axis) and models (X-axis) are clearly labeled in black text, with no overlap or ambiguity.
---
### Conclusion
The heatmap reveals that **TTPD** and **MM** are the most accurate models overall, with **TTPD** excelling in technical tasks and **MM** in geographical classification. However, all models face challenges with **negative categories** (e.g., neg_sp_en_trans, neg_facts), highlighting a need for improved handling of ambiguous or adversarial data. The low standard deviations suggest consistent performance, but the variability in **CCS** (e.g., ±17 for cities) indicates potential instability in certain scenarios.