# Technical Document Extraction: 3D Scatter Plot with Cube
## 1. **Axis Labels and Markers**
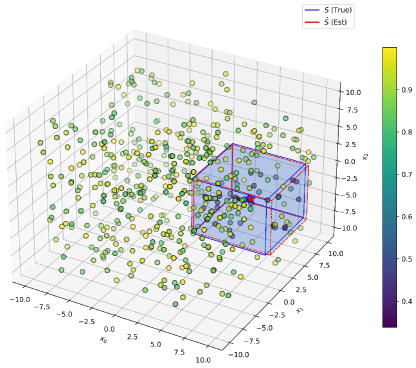
- **X-axis**: Labeled as `x`, ranging from `-10.0` to `10.0` in increments of `2.5`.
- **Y-axis**: Labeled as `y`, ranging from `-10.0` to `10.0` in increments of `2.5`.
- **Z-axis**: Labeled as `z`, ranging from `-10.0` to `10.0` in increments of `2.5`.
- **Gridlines**: Present on all three axes, forming a 3D coordinate system.
## 2. **Legend**
- **Location**: Top-right corner of the plot.
- **Labels**:
- **Blue**: `S (true)` (solid line).
- **Red**: `Ŝ (est)` (dashed line).
- **Color Matching**:
- Blue data points correspond to `S (true)`.
- Red data points correspond to `Ŝ (est)`.
## 3. **Colorbar**
- **Label**: Not explicitly labeled, but inferred as a scalar value (likely `S` or `Ŝ`).
- **Range**: `0.4` (purple) to `1.0` (yellow).
- **Gradient**:
- Purple → Green → Yellow (increasing values).
- **Data Point Correlation**:
- Data points are colored based on their scalar value, matching the colorbar.
## 4. **Main Chart Components**
### A. **3D Scatter Plot**
- **Data Points**:
- Scattered across the 3D space.
- Colors vary from purple (low values) to yellow (high values).
- No explicit numerical data points listed; values inferred from colorbar.
- **Distribution**:
- Points are densely packed in the central region near the origin.
- Some points extend to the edges of the axis ranges.
### B. **Cube**
- **Location**: Centered near the origin (`x ≈ 0`, `y ≈ 0`, `z ≈ 0`).
- **Color**: Purple (matches the mid-range of the colorbar, ~0.7).
- **Outline**:
- Blue dashed lines (matches `S (true)` legend).
- Red dashed lines (matches `Ŝ (est)` legend).
- **Interior**: Contains a red dot at the center, possibly a key data point.
## 5. **Spatial Grounding**
- **Legend Position**: Top-right corner (coordinates: `x ≈ 10`, `y ≈ 10`).
- **Cube Position**: Centered at the origin, with edges spanning from `-2.5` to `2.5` on all axes.
## 6. **Trend Verification**
- **Data Series**:
- **S (true)**: Blue points are distributed throughout the plot, with no clear directional trend.
- **Ŝ (est)**: Red points are concentrated near the cube, suggesting a localized estimation.
- **Cube**: Acts as a reference region, possibly indicating a target or estimated area.
## 7. **Component Isolation**
- **Header**: Legend (top-right).
- **Main Chart**: 3D scatter plot with cube.
- **Footer**: No explicit footer; colorbar is on the right.
## 8. **Additional Notes**
- **Language**: All text is in English.
- **Missing Elements**: No explicit title or subtitle for the plot.
- **Data Table**: No tabular data present; information is visual.
## 9. **Conclusion**
The plot visualizes a 3D distribution of data points with two categories (`S (true)` and `Ŝ (est)`) and a scalar value represented by color. A central cube highlights a region of interest, with a red dot at its center. The legend and colorbar provide critical context for interpreting the data.