## Bar Chart: Normalized Area Comparison Across Technologies
### Overview
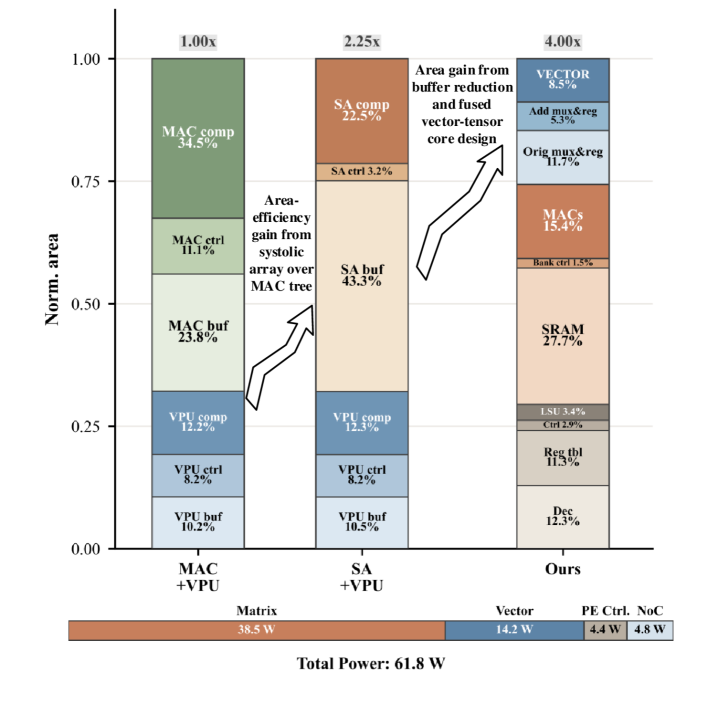
The chart compares normalized area usage across three technology categories: **Matrix**, **SA**, and **Ours**. Each category is segmented into components (e.g., MAC comp, SA buf, SRAM) with color-coded proportions. Arrows indicate efficiency gains, and power consumption values (in watts) are labeled at the base of each bar. Total power consumption is 61.8 W.
---
### Components/Axes
- **Y-axis**: "Norm. area" (normalized area), scaled from 0.00 to 1.00 in increments of 0.25.
- **X-axis**: Three categories: **Matrix**, **SA**, **Ours**.
- **Legend**: Located at the bottom, mapping colors to components:
- Green: MAC comp, MAC ctrl
- Blue: VPU comp, VPU ctrl
- Orange: SA comp, SA buf
- Beige: SA buf, MAC buf
- Light orange: SRAM
- Gray: Rest, Ctrl, NoC
- Dark blue: Vector, Add, PE Ctrl, NoC
---
### Detailed Analysis
#### Matrix
- **MAC comp**: 24.5% (green)
- **MAC ctrl**: 11.3% (light green)
- **MAC buf**: 23.8% (beige)
- **VPU comp**: 12.3% (blue)
- **VPU ctrl**: 8.3% (dark blue)
- **VPU buf**: 10.2% (light blue)
- **Total power**: 38.5 W
#### SA
- **SA comp**: 22.5% (orange)
- **SA buf**: 43.5% (beige)
- **SA ctrl**: 13.3% (dark blue)
- **Total power**: 14.3 W
#### Ours
- **SRAM**: 27.7% (light orange)
- **Rest**: 11.5% (gray)
- **Ctrl**: 3.4% (gray)
- **NoC**: 4.8% (dark blue)
- **PE Ctrl**: 12.5% (light blue)
- **Total power**: 4.8 W
---
### Key Observations
1. **Power Consumption**:
- Matrix consumes the most power (38.5 W), followed by SA (14.3 W), and Ours (4.8 W).
- Total power across all categories sums to 61.8 W.
2. **Area Efficiency**:
- Arrows indicate **area efficiency gains** from SA to Ours, despite Ours having higher normalized area (4.00%) compared to SA (2.25%).
3. **Component Dominance**:
- **SRAM** dominates the "Ours" category (27.7%).
- **SA buf** is the largest component in SA (43.5%).
4. **Efficiency Gains**:
- Arrows highlight reductions in buffer usage and fused core design improvements.
---
### Interpretation
The chart demonstrates a trade-off between **power consumption** and **normalized area** across technologies:
- **Matrix** prioritizes performance but has high power and area usage.
- **SA** improves efficiency (lower power, smaller area) but still relies heavily on buffers (SA buf: 43.5%).
- **Ours** achieves the lowest power (4.8 W) but uses more normalized area (4.00%), likely due to SRAM dominance. The efficiency gains from buffer reduction and fused core design (noted in arrows) suggest architectural optimizations that reduce power at the cost of area.
The data implies that **Ours** balances power efficiency and area usage better than SA, while Matrix remains the least efficient. The inclusion of SRAM in "Ours" may reflect a design choice for faster access at the expense of area.