\n
## Diagram: Federated Learning Data Partitioning
### Overview
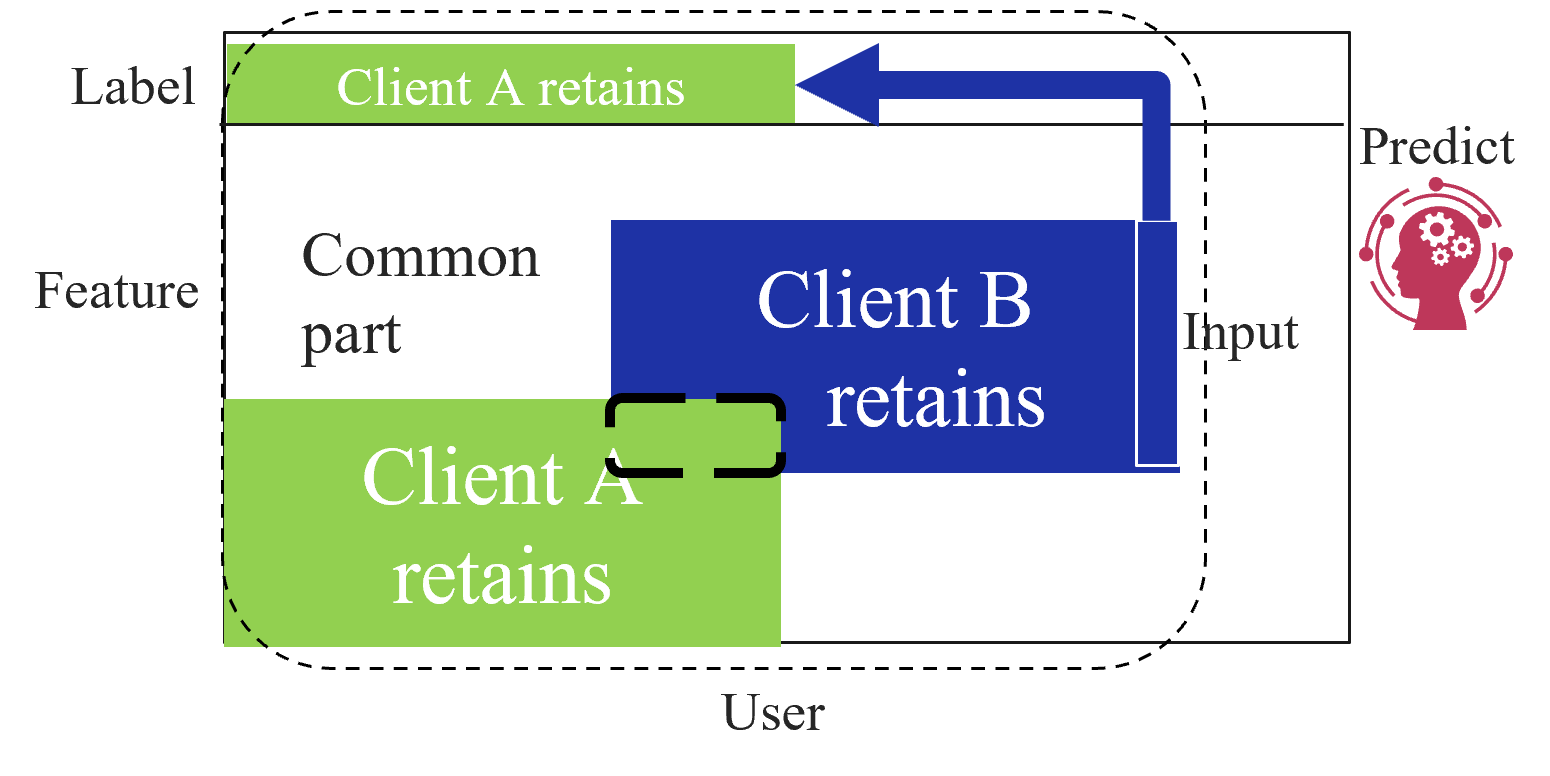
This diagram illustrates a data partitioning scheme used in Federated Learning, specifically showing how data is retained by different clients (Client A and Client B) and the concept of a "common part" of the data. The diagram depicts the flow of data from the clients to a prediction model.
### Components/Axes
The diagram is structured around three main labels: "Label" (vertical axis on the left), "Feature" (vertical axis in the center), and "User" (horizontal axis at the bottom). There is also an "Input" label on the right side, leading to a "Predict" component. The diagram contains three rectangular blocks representing data retained by "Client A", "Client B", and the "Common part". Arrows indicate the flow of data.
### Detailed Analysis or Content Details
The diagram shows three overlapping rectangular areas:
* **Client A retains:** A large, light green rectangle positioned at the bottom-left of the diagram. The text "Client A retains" is written inside. A curved arrow originates from the bottom of this rectangle and points towards the "Client B retains" rectangle.
* **Client B retains:** A large, dark blue rectangle positioned in the center of the diagram. The text "Client B retains" is written inside. An arrow originates from this rectangle and points towards the "Predict" component on the right.
* **Common part:** A smaller, light green rectangle positioned above "Client A retains". The text "Common part" is written inside. An arrow originates from this rectangle and points towards the "Client B retains" rectangle.
The "Predict" component is represented by a stylized human head with gears inside, indicating a machine learning model. The "Input" label is positioned to the right of the "Client B retains" rectangle, with a dashed vertical line separating the data partitioning area from the prediction component.
### Key Observations
The diagram highlights that Client A and Client B each retain a portion of the data, and there is a "Common part" that is shared between them. The curved arrow suggests a potential data transfer or relationship between the data retained by Client A and Client B. The flow of data from both clients ultimately leads to the "Predict" component, indicating that both clients contribute to the prediction model.
### Interpretation
This diagram illustrates a core concept in Federated Learning: decentralized data. Instead of centralizing all data in one location, the data is distributed across multiple clients (A and B). Each client retains its own data, but there's also a common subset. The model is trained on these distributed datasets without directly exchanging the data itself. The "Predict" component represents the global model that benefits from the combined knowledge of all clients. The curved arrow between Client A and Client B could represent a process of model aggregation or parameter sharing, a key step in Federated Learning. The diagram emphasizes the privacy-preserving nature of Federated Learning, as the raw data remains on the clients' devices. The diagram does not provide any quantitative data, but rather a conceptual overview of the data partitioning process.