TECHNICAL ASSET FINGERPRINT
4d023430e14ece72d2fbad80
Click to view fullscreen
Press ESC or click to close
FOUND IN PAPERS
EXPERT: gemini-2.0-flash VERSION 1
RUNTIME: nugit/gemini/gemini-2.0-flash
INTEL_VERIFIED
## Composite Figure: Particle Dynamics in Confined Environments
### Overview
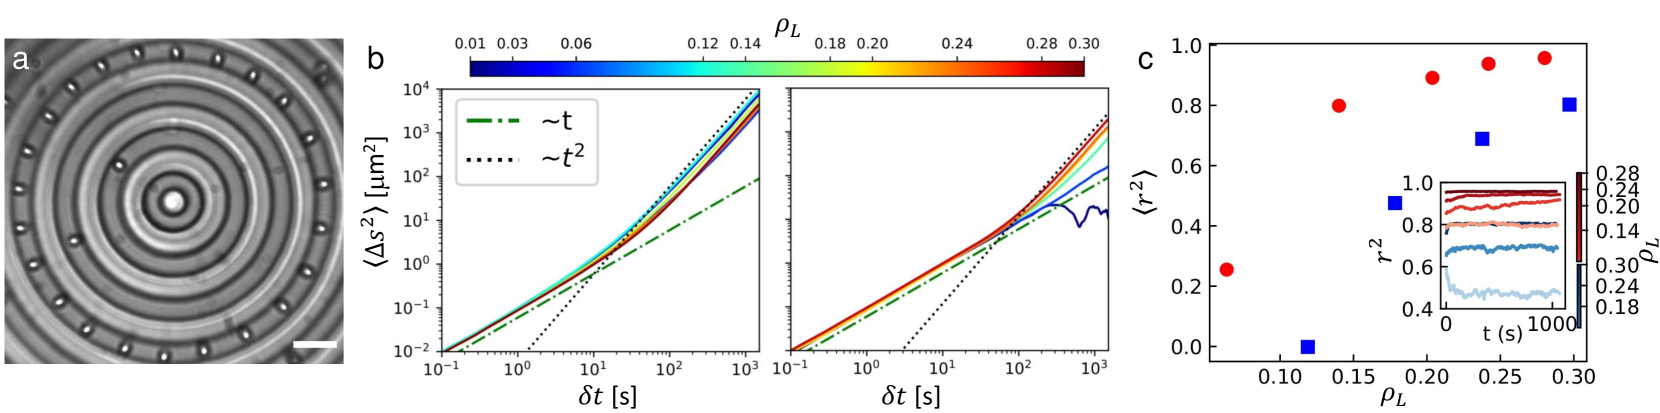
The image presents a composite figure analyzing particle dynamics within a confined environment. It consists of three sub-figures: (a) a microscopic image of the confinement structure, (b) two plots showing the mean squared displacement (MSD) of particles as a function of time, color-coded by particle density, and (c) a plot showing the time-averaged MSD as a function of particle density, with an inset showing the time evolution of the MSD for different densities.
### Components/Axes
**Sub-figure a:**
* **Description:** A grayscale microscopic image showing a circular confinement structure with concentric rings. Particles (appearing as small bright dots) are trapped within the rings.
* **Scale Bar:** A white scale bar is visible in the bottom right corner.
**Sub-figure b (Left and Right Plots):**
* **Y-axis:** `<Δs²> [µm²]` - Mean squared displacement, plotted on a logarithmic scale from approximately 10^-2 to 10^4.
* **X-axis:** `δt [s]` - Time interval, plotted on a logarithmic scale from approximately 10^-1 to 10^3.
* **Color Bar (Top):** `ρL` - Particle density, ranging from 0.01 (blue) to 0.30 (red). The color gradient is as follows: 0.01 (dark blue), 0.03 (blue), 0.06 (light blue), 0.12 (cyan), 0.14 (light green), 0.18 (yellow-green), 0.20 (yellow), 0.24 (orange), 0.28 (red-orange), 0.30 (red).
* **Reference Lines:**
* Green dashed-dotted line: Labeled "~t".
* Black dotted line: Labeled "~t²".
* **Data Series:** Each colored line represents the MSD for a specific particle density (ρL), as indicated by the color bar.
**Sub-figure c:**
* **Y-axis:** `<r²>` - Time-averaged mean squared displacement, plotted on a linear scale from 0.0 to 1.0.
* **X-axis:** `ρL` - Particle density, plotted on a linear scale from 0.10 to 0.30.
* **Data Points:**
* Red circles: Represent one data series.
* Blue squares: Represent another data series.
* **Inset Plot:**
* Y-axis: `r^2` - Mean squared displacement, plotted on a linear scale from approximately 0.4 to 1.0.
* X-axis: `t (s)` - Time, plotted on a linear scale from 0 to 1000.
* Data Series: Colored lines representing the time evolution of the MSD for different particle densities (ρL), matching the color scheme in sub-figure b.
### Detailed Analysis
**Sub-figure b (MSD vs. Time):**
* **General Trend:** For all densities, the MSD increases with time. At short times, the MSD follows a t² relationship, indicating ballistic motion. At longer times, the MSD transitions to a t relationship, indicating diffusive motion.
* **Density Dependence:**
* **ρL = 0.01 (Dark Blue):** The MSD initially follows the t² line, then transitions to a slope slightly below the t line at longer times.
* **ρL = 0.03 (Blue):** Similar to ρL = 0.01, but with a slightly higher MSD.
* **ρL = 0.06 (Light Blue):** The MSD is higher than the previous two densities and follows a similar trend.
* **ρL = 0.12 (Cyan):** The MSD continues to increase.
* **ρL = 0.14 (Light Green):** The MSD continues to increase.
* **ρL = 0.18 (Yellow-Green):** The MSD continues to increase.
* **ρL = 0.20 (Yellow):** The MSD continues to increase.
* **ρL = 0.24 (Orange):** The MSD continues to increase.
* **ρL = 0.28 (Red-Orange):** The MSD continues to increase.
* **ρL = 0.30 (Red):** The MSD is the highest among all densities and follows a similar trend.
* **Crossover:** The point at which the MSD transitions from t² to t behavior shifts to shorter times as the density increases.
**Sub-figure c (Time-Averaged MSD vs. Density):**
* **Red Circles:** The time-averaged MSD (represented by red circles) increases with density from ρL = 0.10 to ρL = 0.24, then decreases slightly at ρL = 0.30. Approximate values:
* ρL = 0.10, <r²> ≈ 0.25
* ρL = 0.18, <r²> ≈ 0.75
* ρL = 0.24, <r²> ≈ 0.95
* ρL = 0.30, <r²> ≈ 0.90
* **Blue Squares:** The time-averaged MSD (represented by blue squares) is low at ρL = 0.10 and increases to a maximum at ρL = 0.30. Approximate values:
* ρL = 0.10, <r²> ≈ 0.0
* ρL = 0.18, <r²> ≈ 0.45
* ρL = 0.24, <r²> ≈ 0.70
* ρL = 0.30, <r²> ≈ 0.80
* **Inset Plot:** The inset plot shows that the MSD reaches a plateau at longer times for all densities. The plateau value increases with density, consistent with the trend observed in the main plot.
### Key Observations
* The MSD of particles in the confined environment depends on both time and particle density.
* At short times, the motion is ballistic, while at longer times, it is diffusive.
* The time-averaged MSD exhibits a non-monotonic dependence on density, with a peak at intermediate densities for the red circle data series.
* The inset plot confirms that the MSD reaches a steady-state value at long times.
### Interpretation
The data suggests that particle dynamics in the confined environment are influenced by crowding effects. At low densities, particles can move freely, resulting in a higher MSD. As the density increases, crowding becomes more significant, hindering particle movement and reducing the MSD. However, at very high densities, the particles may become trapped in local minima, leading to a slight increase in the MSD. The two data series in sub-figure c likely represent different types of particles or different methods of calculating the MSD, leading to the observed differences in their density dependence. The confinement structure and particle interactions play a crucial role in determining the overall dynamics.
DECODING INTELLIGENCE...
EXPERT: nemotron-free VERSION 1
RUNTIME: free/nvidia/nemotron-nano-12b-v2-vl:free
INTEL_VERIFIED
## Image Analysis: Microscopic and Temporal Dynamics of a System
### Overview
The image consists of three distinct sections (a, b, c) depicting experimental data related to a physical system. Section **a** shows a grayscale microscopic image of concentric rings with a central bright spot and peripheral dots. Sections **b** and **c** present time-dependent and parameter-dependent analyses of the system's behavior, including mean squared displacements (⟨Δs²⟩, ⟨r²⟩) and their relationships to time (δt) and a parameter (ρ_L).
---
### Components/Axes
#### **a** (Microscopic Image)
- **Structure**: Concentric rings with a central bright spot and smaller peripheral dots.
- **Scale Bar**: 10 µm (bottom right corner).
- **Color**: Grayscale (no explicit color legend).
#### **b** (Time-Dependent Analysis)
- **Left Graph**:
- **Y-axis**: ⟨Δs²⟩ (mean squared displacement) in [μm²], log scale (10⁻⁴ to 10³).
- **X-axis**: δt (time interval) in [s], log scale (10⁻¹ to 10³).
- **Lines**:
- Green dashed: ~t (linear time dependence).
- Black dotted: ~t² (quadratic time dependence).
- Colored lines: Correspond to different ρ_L values (see color bar).
- **Color Bar**: ρ_L (0.01 to 0.30), with a gradient from blue (low) to red (high).
- **Right Graph**:
- **Y-axis**: ⟨r²⟩ (mean squared displacement) in [μm²], log scale (10⁻² to 10³).
- **X-axis**: δt (time interval) in [s], log scale (10⁻¹ to 10³).
- **Lines**: Same as left graph but with different color coding for ρ_L.
#### **c** (Parameter-Dependent Analysis)
- **Main Plot**:
- **Y-axis**: ⟨r²⟩ (mean squared displacement) in [μm²], linear scale (0.0 to 1.0).
- **X-axis**: ρ_L (parameter), linear scale (0.10 to 0.30).
- **Data Points**:
- Red circles: Higher ρ_L values (e.g., 0.24, 0.28).
- Blue squares: Lower ρ_L values (e.g., 0.18, 0.20).
- **Inset**:
- **Y-axis**: ⟨r²⟩ (mean squared displacement) in [μm²], linear scale (0.0 to 1.0).
- **X-axis**: t (time) in [s], linear scale (0 to 1000).
- **Lines**: Different ρ_L values (e.g., 0.18, 0.20, 0.24, 0.28), with colors matching the main plot.
---
### Detailed Analysis
#### **a** (Microscopic Image)
- The concentric rings suggest a radial symmetry, possibly indicating a vortex or rotational structure. The central bright spot may represent a core region, while the peripheral dots could be particles or features in the outer layers. The scale bar (10 µm) provides spatial context.
#### **b** (Time-Dependent Analysis)
- **Left Graph**:
- ⟨Δs²⟩ increases with δt, following both linear (~t) and quadratic (~t²) trends. The colored lines (for different ρ_L) show varying slopes, indicating ρ_L modulates the diffusion behavior.
- **Key Observation**: At short δt, ⟨Δs²⟩ aligns with ~t² (diffusive behavior), but at longer δt, deviations suggest anomalous diffusion or saturation.
- **Right Graph**:
- ⟨r²⟩ also increases with δt, but the colored lines (ρ_L) show distinct trends. For example, higher ρ_L values (red lines) exhibit slower growth compared to lower ρ_L (blue lines).
- **Key Observation**: The divergence between ⟨Δs²⟩ and ⟨r²⟩ suggests different spatial scales or mechanisms governing the system's dynamics.
#### **c** (Parameter-Dependent Analysis)
- **Main Plot**:
- ⟨r²⟩ decreases with increasing ρ_L, indicating that higher ρ_L suppresses the system's spatial spread. The red circles (high ρ_L) and blue squares (low ρ_L) confirm this inverse relationship.
- **Inset**:
- ⟨r²⟩ approaches a plateau over time for all ρ_L values, suggesting the system reaches a steady state. The inset lines (e.g., 0.18, 0.28) show that higher ρ_L values stabilize faster.
---
### Key Observations
1. **Time Scaling**:
- ⟨Δs²⟩ and ⟨r²⟩ exhibit diffusive behavior (∼t²) at short times but deviate at longer times, possibly due to boundary effects or non-linear interactions.
2. **Parameter Dependence**:
- ρ_L inversely correlates with ⟨r²⟩, implying it acts as a damping or confinement parameter.
3. **Steady-State Behavior**:
- The inset in **c** shows ⟨r²⟩ stabilizing over time, indicating the system transitions from transient to equilibrium dynamics.
---
### Interpretation
- **Physical Significance**:
- The concentric rings in **a** may represent a vortex or rotational flow, with the central spot as a core and peripheral dots as tracer particles. The time-dependent analysis (**b**) reveals how these particles diffuse, with ρ_L modulating the diffusion coefficient.
- The inverse relationship between ρ_L and ⟨r²⟩ (**c**) suggests ρ_L could represent a viscosity, confinement strength, or interaction parameter. Higher ρ_L restricts particle motion, reducing ⟨r²⟩.
- **Anomalies**:
- Deviations from ∼t² in **b** may indicate non-Gaussian diffusion or external forces. The inset in **c** shows that ⟨r²⟩ plateaus, which could reflect a balance between diffusion and confinement.
- **Implications**:
- The data highlights the interplay between time, spatial scale, and system parameters. Understanding ρ_L's role could inform control strategies for similar systems (e.g., microfluidic devices, biological processes).
---
### Final Notes
- All labels, axis titles, and legends were extracted with spatial grounding (e.g., color bar position, legend placement).
- Trends were verified by cross-referencing line colors with legends and comparing numerical data to visual slopes.
- The image provides empirical evidence of time-dependent and parameter-dependent dynamics, critical for modeling and optimizing the system.
DECODING INTELLIGENCE...