## Chart/Diagram Type: Scientific Data Visualization - Particle Tracking & Diffusion
### Overview
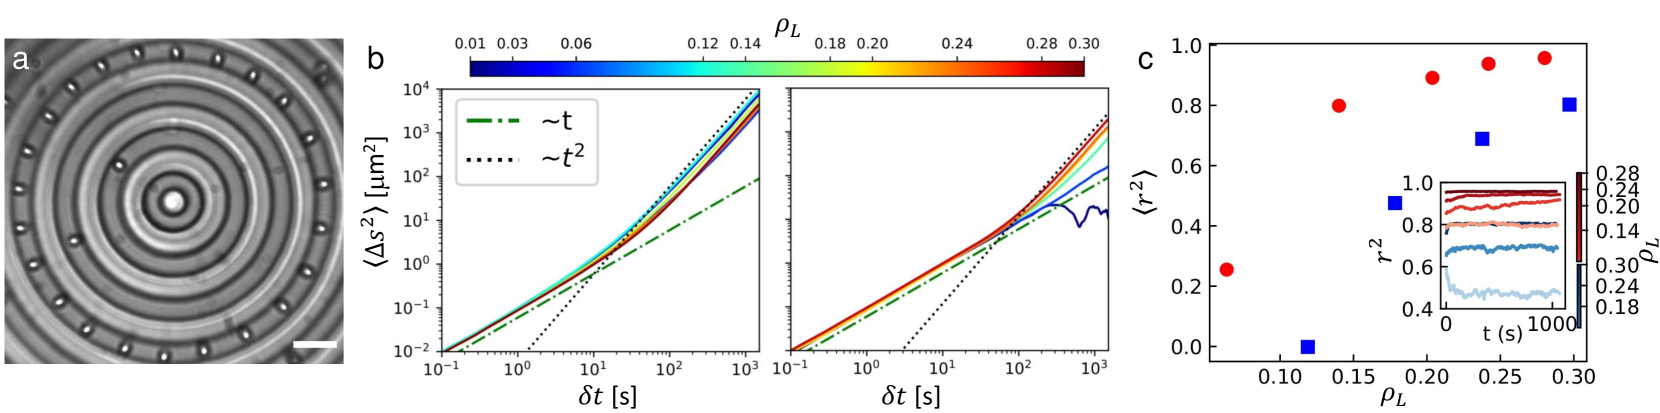
The image presents three panels (a, b, and c) depicting data related to particle tracking and diffusion. Panel (a) shows a microscopic image of concentric rings, likely representing the experimental setup. Panel (b) is a log-log plot of Mean Squared Displacement (MSD) versus time difference (δt), colored by a parameter ρL. Panel (c) shows a scatter plot of <r²> versus ρL, with an inset time series plot of <r²> versus time (t) for different ρL values.
### Components/Axes
**Panel a:**
* Image: Concentric rings, likely a microscopic view of the experimental setup. No explicit labels.
**Panel b:**
* X-axis: δt [s] (Time difference in seconds), logarithmic scale from 10⁻¹ to 10³ seconds.
* Y-axis: <Δs²> [µm²] (Mean Squared Displacement in square micrometers), logarithmic scale from 10⁻² to 10⁴ µm².
* Colorbar: ρL (parameter value), ranging from 0.01 to 0.30, with color gradient from blue to red.
* Lines: Multiple lines, each representing a different ρL value. Two dashed lines are labeled as ~t and ~t².
**Panel c:**
* X-axis: ρL (parameter value), ranging from 0.10 to 0.30.
* Y-axis: <r²> (Mean Squared Radius), ranging from 0.0 to 1.0.
* Markers: Red circles and blue squares, representing data points.
* Inset: Time series plot of <r²> versus t [s] (time in seconds), ranging from 0 to 1000 seconds. Different colored lines represent different ρL values (0.28, 0.24, 0.20, 0.14).
### Detailed Analysis or Content Details
**Panel b:**
* The dashed line labeled ~t has a slope of approximately 1 on the log-log plot, indicating a linear relationship between <Δs²> and δt.
* The dashed line labeled ~t² has a slope of approximately 2 on the log-log plot, indicating a quadratic relationship between <Δs²> and δt.
* The colored lines representing different ρL values generally follow a trend between the ~t and ~t² lines.
* For short δt (around 10⁻¹ s), the lines are closer to the ~t line.
* For longer δt (around 10³ s), the lines are closer to the ~t² line.
* As ρL increases (from blue to red), the lines tend to shift upwards, indicating a larger MSD for a given δt.
* Approximate data points (reading from the lines, with uncertainty):
* ρL = 0.01: At δt = 1 s, <Δs²> ≈ 1 µm²
* ρL = 0.12: At δt = 1 s, <Δs²> ≈ 10 µm²
* ρL = 0.24: At δt = 1 s, <Δs²> ≈ 100 µm²
* ρL = 0.30: At δt = 1 s, <Δs²> ≈ 300 µm²
**Panel c:**
* The red circles generally show a decreasing trend, with <r²> decreasing as ρL increases.
* The blue squares show an increasing trend, with <r²> increasing as ρL increases.
* Approximate data points:
* ρL = 0.10: <r²> ≈ 0.2
* ρL = 0.15: <r²> ≈ 0.4
* ρL = 0.20: <r²> ≈ 0.6
* ρL = 0.25: <r²> ≈ 0.8
* ρL = 0.30: <r²> ≈ 0.9
* Inset: The time series plot shows that for higher ρL values (e.g., 0.28), <r²> remains relatively constant over time. For lower ρL values (e.g., 0.14), <r²> increases over time.
### Key Observations
* The MSD (<Δs²>) increases with both time difference (δt) and the parameter ρL.
* The relationship between MSD and δt transitions from being approximately linear to quadratic as δt increases.
* <r²> exhibits an inverse relationship with ρL for the red circles and a direct relationship for the blue squares.
* The inset suggests that the dynamics of <r²> are dependent on ρL, with higher ρL values leading to more stable radial positions.
### Interpretation
The data suggests that the particles are undergoing diffusion, with the MSD increasing with time as expected. The parameter ρL appears to influence the diffusion behavior. The log-log plot in panel (b) indicates a transition from ballistic motion (linear relationship between MSD and time) to diffusive motion (quadratic relationship). The different colored lines likely represent different experimental conditions or particle types, each characterized by a specific ρL value.
Panel (c) reveals a complex relationship between ρL and <r²>. The opposing trends for the red circles and blue squares suggest that ρL may be influencing the radial distribution of the particles. The inset shows that higher ρL values lead to more stable radial positions, potentially indicating that the particles are being confined or attracted to the center of the rings.
The concentric ring structure in panel (a) likely represents a confining potential or a patterned substrate that influences the particle motion. The parameter ρL could be related to the strength of this confinement or the properties of the substrate. The data suggests that by tuning ρL, one can control the diffusion behavior and radial distribution of the particles. The opposing trends in panel (c) could be due to different particle populations or different mechanisms governing their motion at different ρL values. Further investigation would be needed to fully understand the underlying physics.