## Image Analysis: Microscopic and Temporal Dynamics of a System
### Overview
The image consists of three distinct sections (a, b, c) depicting experimental data related to a physical system. Section **a** shows a grayscale microscopic image of concentric rings with a central bright spot and peripheral dots. Sections **b** and **c** present time-dependent and parameter-dependent analyses of the system's behavior, including mean squared displacements (⟨Δs²⟩, ⟨r²⟩) and their relationships to time (δt) and a parameter (ρ_L).
---
### Components/Axes
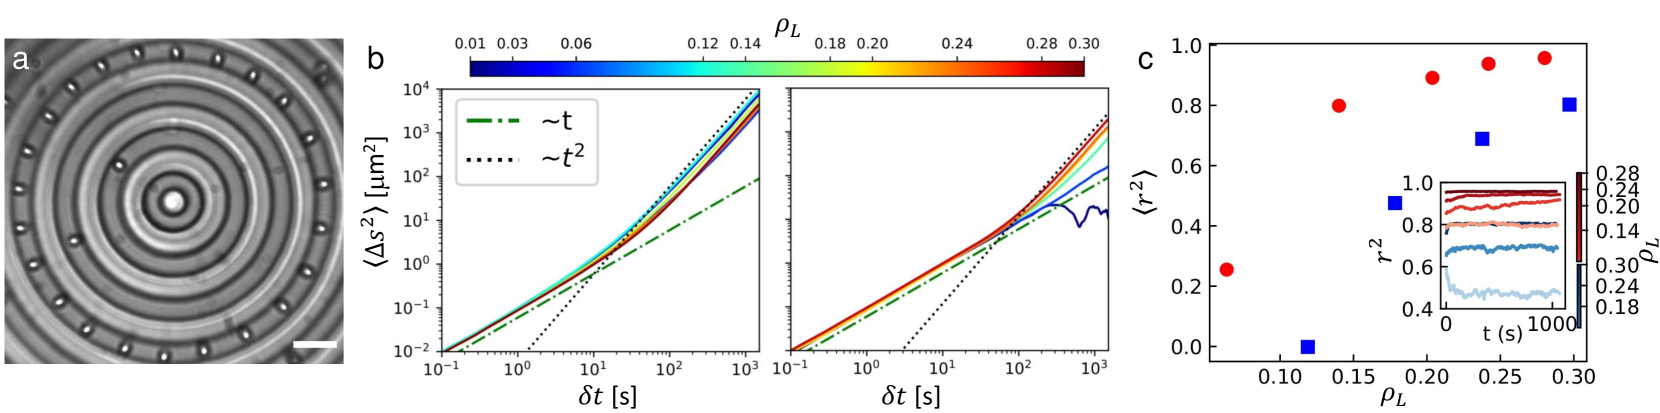
#### **a** (Microscopic Image)
- **Structure**: Concentric rings with a central bright spot and smaller peripheral dots.
- **Scale Bar**: 10 µm (bottom right corner).
- **Color**: Grayscale (no explicit color legend).
#### **b** (Time-Dependent Analysis)
- **Left Graph**:
- **Y-axis**: ⟨Δs²⟩ (mean squared displacement) in [μm²], log scale (10⁻⁴ to 10³).
- **X-axis**: δt (time interval) in [s], log scale (10⁻¹ to 10³).
- **Lines**:
- Green dashed: ~t (linear time dependence).
- Black dotted: ~t² (quadratic time dependence).
- Colored lines: Correspond to different ρ_L values (see color bar).
- **Color Bar**: ρ_L (0.01 to 0.30), with a gradient from blue (low) to red (high).
- **Right Graph**:
- **Y-axis**: ⟨r²⟩ (mean squared displacement) in [μm²], log scale (10⁻² to 10³).
- **X-axis**: δt (time interval) in [s], log scale (10⁻¹ to 10³).
- **Lines**: Same as left graph but with different color coding for ρ_L.
#### **c** (Parameter-Dependent Analysis)
- **Main Plot**:
- **Y-axis**: ⟨r²⟩ (mean squared displacement) in [μm²], linear scale (0.0 to 1.0).
- **X-axis**: ρ_L (parameter), linear scale (0.10 to 0.30).
- **Data Points**:
- Red circles: Higher ρ_L values (e.g., 0.24, 0.28).
- Blue squares: Lower ρ_L values (e.g., 0.18, 0.20).
- **Inset**:
- **Y-axis**: ⟨r²⟩ (mean squared displacement) in [μm²], linear scale (0.0 to 1.0).
- **X-axis**: t (time) in [s], linear scale (0 to 1000).
- **Lines**: Different ρ_L values (e.g., 0.18, 0.20, 0.24, 0.28), with colors matching the main plot.
---
### Detailed Analysis
#### **a** (Microscopic Image)
- The concentric rings suggest a radial symmetry, possibly indicating a vortex or rotational structure. The central bright spot may represent a core region, while the peripheral dots could be particles or features in the outer layers. The scale bar (10 µm) provides spatial context.
#### **b** (Time-Dependent Analysis)
- **Left Graph**:
- ⟨Δs²⟩ increases with δt, following both linear (~t) and quadratic (~t²) trends. The colored lines (for different ρ_L) show varying slopes, indicating ρ_L modulates the diffusion behavior.
- **Key Observation**: At short δt, ⟨Δs²⟩ aligns with ~t² (diffusive behavior), but at longer δt, deviations suggest anomalous diffusion or saturation.
- **Right Graph**:
- ⟨r²⟩ also increases with δt, but the colored lines (ρ_L) show distinct trends. For example, higher ρ_L values (red lines) exhibit slower growth compared to lower ρ_L (blue lines).
- **Key Observation**: The divergence between ⟨Δs²⟩ and ⟨r²⟩ suggests different spatial scales or mechanisms governing the system's dynamics.
#### **c** (Parameter-Dependent Analysis)
- **Main Plot**:
- ⟨r²⟩ decreases with increasing ρ_L, indicating that higher ρ_L suppresses the system's spatial spread. The red circles (high ρ_L) and blue squares (low ρ_L) confirm this inverse relationship.
- **Inset**:
- ⟨r²⟩ approaches a plateau over time for all ρ_L values, suggesting the system reaches a steady state. The inset lines (e.g., 0.18, 0.28) show that higher ρ_L values stabilize faster.
---
### Key Observations
1. **Time Scaling**:
- ⟨Δs²⟩ and ⟨r²⟩ exhibit diffusive behavior (∼t²) at short times but deviate at longer times, possibly due to boundary effects or non-linear interactions.
2. **Parameter Dependence**:
- ρ_L inversely correlates with ⟨r²⟩, implying it acts as a damping or confinement parameter.
3. **Steady-State Behavior**:
- The inset in **c** shows ⟨r²⟩ stabilizing over time, indicating the system transitions from transient to equilibrium dynamics.
---
### Interpretation
- **Physical Significance**:
- The concentric rings in **a** may represent a vortex or rotational flow, with the central spot as a core and peripheral dots as tracer particles. The time-dependent analysis (**b**) reveals how these particles diffuse, with ρ_L modulating the diffusion coefficient.
- The inverse relationship between ρ_L and ⟨r²⟩ (**c**) suggests ρ_L could represent a viscosity, confinement strength, or interaction parameter. Higher ρ_L restricts particle motion, reducing ⟨r²⟩.
- **Anomalies**:
- Deviations from ∼t² in **b** may indicate non-Gaussian diffusion or external forces. The inset in **c** shows that ⟨r²⟩ plateaus, which could reflect a balance between diffusion and confinement.
- **Implications**:
- The data highlights the interplay between time, spatial scale, and system parameters. Understanding ρ_L's role could inform control strategies for similar systems (e.g., microfluidic devices, biological processes).
---
### Final Notes
- All labels, axis titles, and legends were extracted with spatial grounding (e.g., color bar position, legend placement).
- Trends were verified by cross-referencing line colors with legends and comparing numerical data to visual slopes.
- The image provides empirical evidence of time-dependent and parameter-dependent dynamics, critical for modeling and optimizing the system.