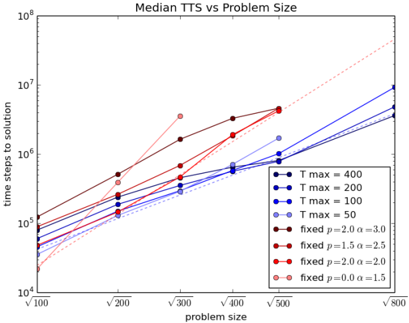
## Chart: Median TTS vs Problem Size
### Overview
The image is a line chart that plots the median Time To Solution (TTS) against the problem size. The y-axis (time steps to solution) is on a logarithmic scale, ranging from 10^4 to 10^8. The x-axis (problem size) displays the square root of the problem size, with values ranging from approximately 10 to 28 (corresponding to problem sizes of 100 to 800). Several lines represent different configurations or parameters, as indicated by the legend.
### Components/Axes
* **Title:** Median TTS vs Problem Size
* **X-axis:** problem size (values: √100, √200, √300, √400, √500, √800)
* **Y-axis:** time steps to solution (logarithmic scale, values: 10^4, 10^5, 10^6, 10^7, 10^8)
* **Legend (located on the right side of the chart):**
* Blue: T max = 400
* Dark Blue: T max = 200
* Medium Blue: T max = 100
* Light Blue: T max = 50
* Dark Red: fixed p=2.0 α=3.0
* Red: fixed p=1.5 α=2.5
* Light Red: fixed p=2.0 α=2.0
* Pink: fixed p=0.0 α=1.5
### Detailed Analysis
* **T max = 400 (Blue):** The line starts at approximately (√100, 2 * 10^5) and increases to approximately (√800, 7 * 10^6). The trend is upward.
* **T max = 200 (Dark Blue):** The line starts at approximately (√100, 1.5 * 10^5) and increases to approximately (√800, 6 * 10^6). The trend is upward.
* **T max = 100 (Medium Blue):** The line starts at approximately (√100, 8 * 10^4) and increases to approximately (√800, 4 * 10^6). The trend is upward.
* **T max = 50 (Light Blue):** The line starts at approximately (√100, 4 * 10^4) and increases to approximately (√800, 2 * 10^6). The trend is upward.
* **fixed p=2.0 α=3.0 (Dark Red):** The line starts at approximately (√100, 7 * 10^4) and increases to approximately (√500, 4 * 10^6). The trend is upward.
* **fixed p=1.5 α=2.5 (Red):** The line starts at approximately (√100, 4 * 10^4) and increases to approximately (√500, 2 * 10^6). The trend is upward.
* **fixed p=2.0 α=2.0 (Light Red):** The line starts at approximately (√100, 2 * 10^4) and increases to approximately (√500, 1 * 10^6). The trend is upward.
* **fixed p=0.0 α=1.5 (Pink):** The line starts at approximately (√100, 1.5 * 10^4) and increases to approximately (√300, 1.5 * 10^6). The trend is upward. This line is dashed.
### Key Observations
* All lines show an upward trend, indicating that the median time to solution increases as the problem size increases.
* The "T max" lines (blue shades) generally show a less steep increase compared to the "fixed" lines (red shades).
* The "fixed p=0.0 α=1.5" line (pink) has the steepest increase initially.
### Interpretation
The chart illustrates the relationship between problem size and the median time to solution (TTS) for different configurations. The upward trend in all lines suggests that larger problem sizes require more time steps to find a solution. The different slopes of the lines indicate that certain configurations (e.g., "fixed" parameters) are more sensitive to problem size increases than others (e.g., "T max" parameters). The "fixed p=0.0 α=1.5" configuration appears to scale very poorly with problem size, as indicated by its steep initial increase. The data suggests that tuning parameters can significantly impact the scalability of the solution.