## Line Chart: Median TTS vs Problem Size
### Overview
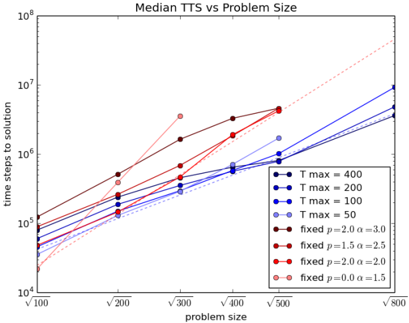
The chart compares the median time-to-solution (TTS) across varying problem sizes (x-axis) for different configurations of a system. The y-axis represents time steps to solution on a logarithmic scale (10⁴ to 10⁸). Multiple data series are plotted, differentiated by T max values and fixed parameters (p, α).
### Components/Axes
- **X-axis (Problem Size)**: Logarithmic scale with values √100, √200, √300, √400, √500, √800.
- **Y-axis (Time Steps to Solution)**: Logarithmic scale from 10⁴ to 10⁸.
- **Legend**: Located in the bottom-right corner, with 7 data series:
- **T max = 400** (dark blue, circles)
- **T max = 200** (blue, squares)
- **T max = 100** (light blue, triangles)
- **T max = 50** (dashed blue, diamonds)
- **Fixed p=2.0 α=3.0** (brown, solid line)
- **Fixed p=1.5 α=2.5** (red, solid line)
- **Fixed p=2.0 α=2.0** (dark red, dashed line)
- **Fixed p=0.0 α=1.5** (pink, dotted line)
### Detailed Analysis
1. **T max Series**:
- **T max = 400** (dark blue): Steepest upward slope, reaching ~10⁷ at √500 and ~10⁸ at √800.
- **T max = 200** (blue): Slower growth than T max = 400, ~10⁶ at √500, ~10⁷ at √800.
- **T max = 100** (light blue): ~10⁵ at √500, ~10⁶ at √800.
- **T max = 50** (dashed blue): ~10⁴ at √500, ~10⁵ at √800.
2. **Fixed Parameters Series**:
- **p=2.0 α=3.0** (brown): ~10⁵ at √500, ~10⁶ at √800.
- **p=1.5 α=2.5** (red): ~10⁶ at √500, ~10⁷ at √800.
- **p=2.0 α=2.0** (dark red): ~10⁵ at √500, ~10⁶ at √800.
- **p=0.0 α=1.5** (pink): Steepest slope, ~10⁶ at √500, ~10⁸ at √800.
### Key Observations
- **Inverse Relationship**: Higher T max values correlate with longer time steps to solution.
- **Fixed Parameters Impact**: Lower p and α values (e.g., p=0.0 α=1.5) result in significantly steeper growth curves.
- **Outliers**: The pink dotted line (p=0.0 α=1.5) diverges sharply from other series, suggesting extreme sensitivity to these parameters.
### Interpretation
The data demonstrates that system efficiency degrades with larger problem sizes, particularly under high T max settings. Fixed parameters (p, α) critically influence scalability: lower values (e.g., p=0.0) exacerbate time-step growth, while higher values (e.g., p=2.0 α=3.0) mitigate it. This suggests optimizing p and α is crucial for managing computational load in large-scale problems. The T max parameter acts as a tunable threshold, with higher values amplifying the system's resource demands.