# Technical Document Extraction: HotPotQA CoT (GT) Performance Chart
## 1. Header Information
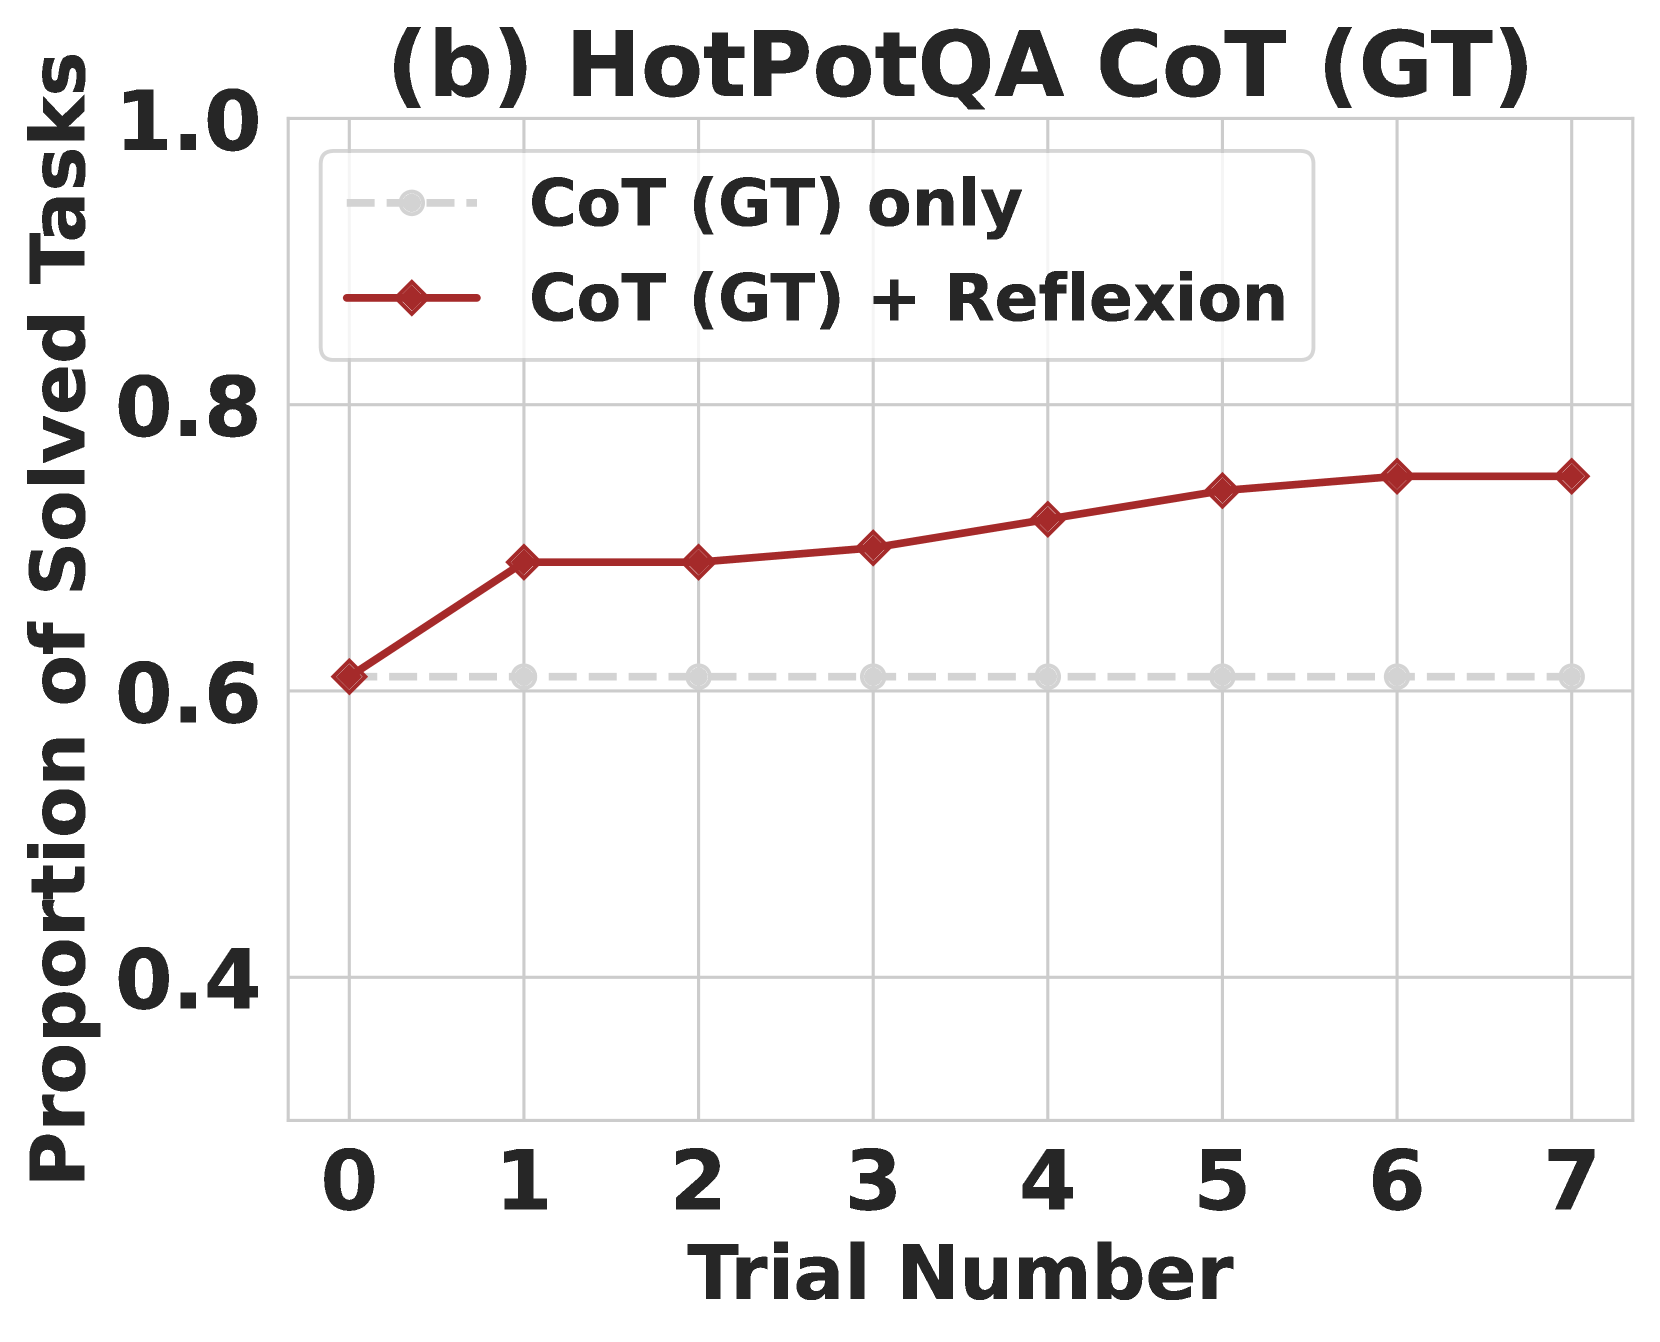
* **Title:** (b) HotPotQA CoT (GT)
## 2. Axis Specifications
* **Y-Axis Label:** Proportion of Solved Tasks
* **Y-Axis Scale:** 0.3 to 1.0 (increments of 0.2 labeled: 0.4, 0.6, 0.8, 1.0)
* **X-Axis Label:** Trial Number
* **X-Axis Scale:** 0 to 7 (integer increments)
## 3. Legend Information
* **Location:** Top-left quadrant of the chart area.
* **Series 1:** `CoT (GT) only`
* **Visual Representation:** Light gray dashed line with circular markers.
* **Series 2:** `CoT (GT) + Reflexion`
* **Visual Representation:** Dark red solid line with diamond-shaped markers.
## 4. Data Series Analysis
### Series 1: CoT (GT) only
* **Trend:** This is a static baseline. The line is perfectly horizontal across all trials.
* **Data Points:**
* Trial 0 through Trial 7: Constant value of approximately **0.61**.
### Series 2: CoT (GT) + Reflexion
* **Trend:** This series shows a positive upward trend, indicating improvement over successive trials. There is a significant jump between Trial 0 and Trial 1, followed by a plateau, and then a steady incremental climb from Trial 3 to Trial 6, stabilizing at Trial 7.
* **Data Points (Estimated):**
* **Trial 0:** ~0.61 (Starts at the same point as the baseline)
* **Trial 1:** ~0.69
* **Trial 2:** ~0.69
* **Trial 3:** ~0.70
* **Trial 4:** ~0.72
* **Trial 5:** ~0.74
* **Trial 6:** ~0.75
* **Trial 7:** ~0.75
## 5. Key Findings and Summary
* **Baseline Performance:** The standard Chain of Thought (Ground Truth) approach solves approximately 61% of tasks.
* **Reflexion Impact:** Adding the "Reflexion" mechanism results in an immediate performance boost after the first trial (increasing from ~0.61 to ~0.69).
* **Iterative Improvement:** The Reflexion method continues to improve performance over multiple trials, eventually reaching a peak of approximately 75% solved tasks by Trial 6, representing a total gain of roughly 14 percentage points over the baseline.