## Line Chart: (b) HotPotQA CoT (GT)
### Overview
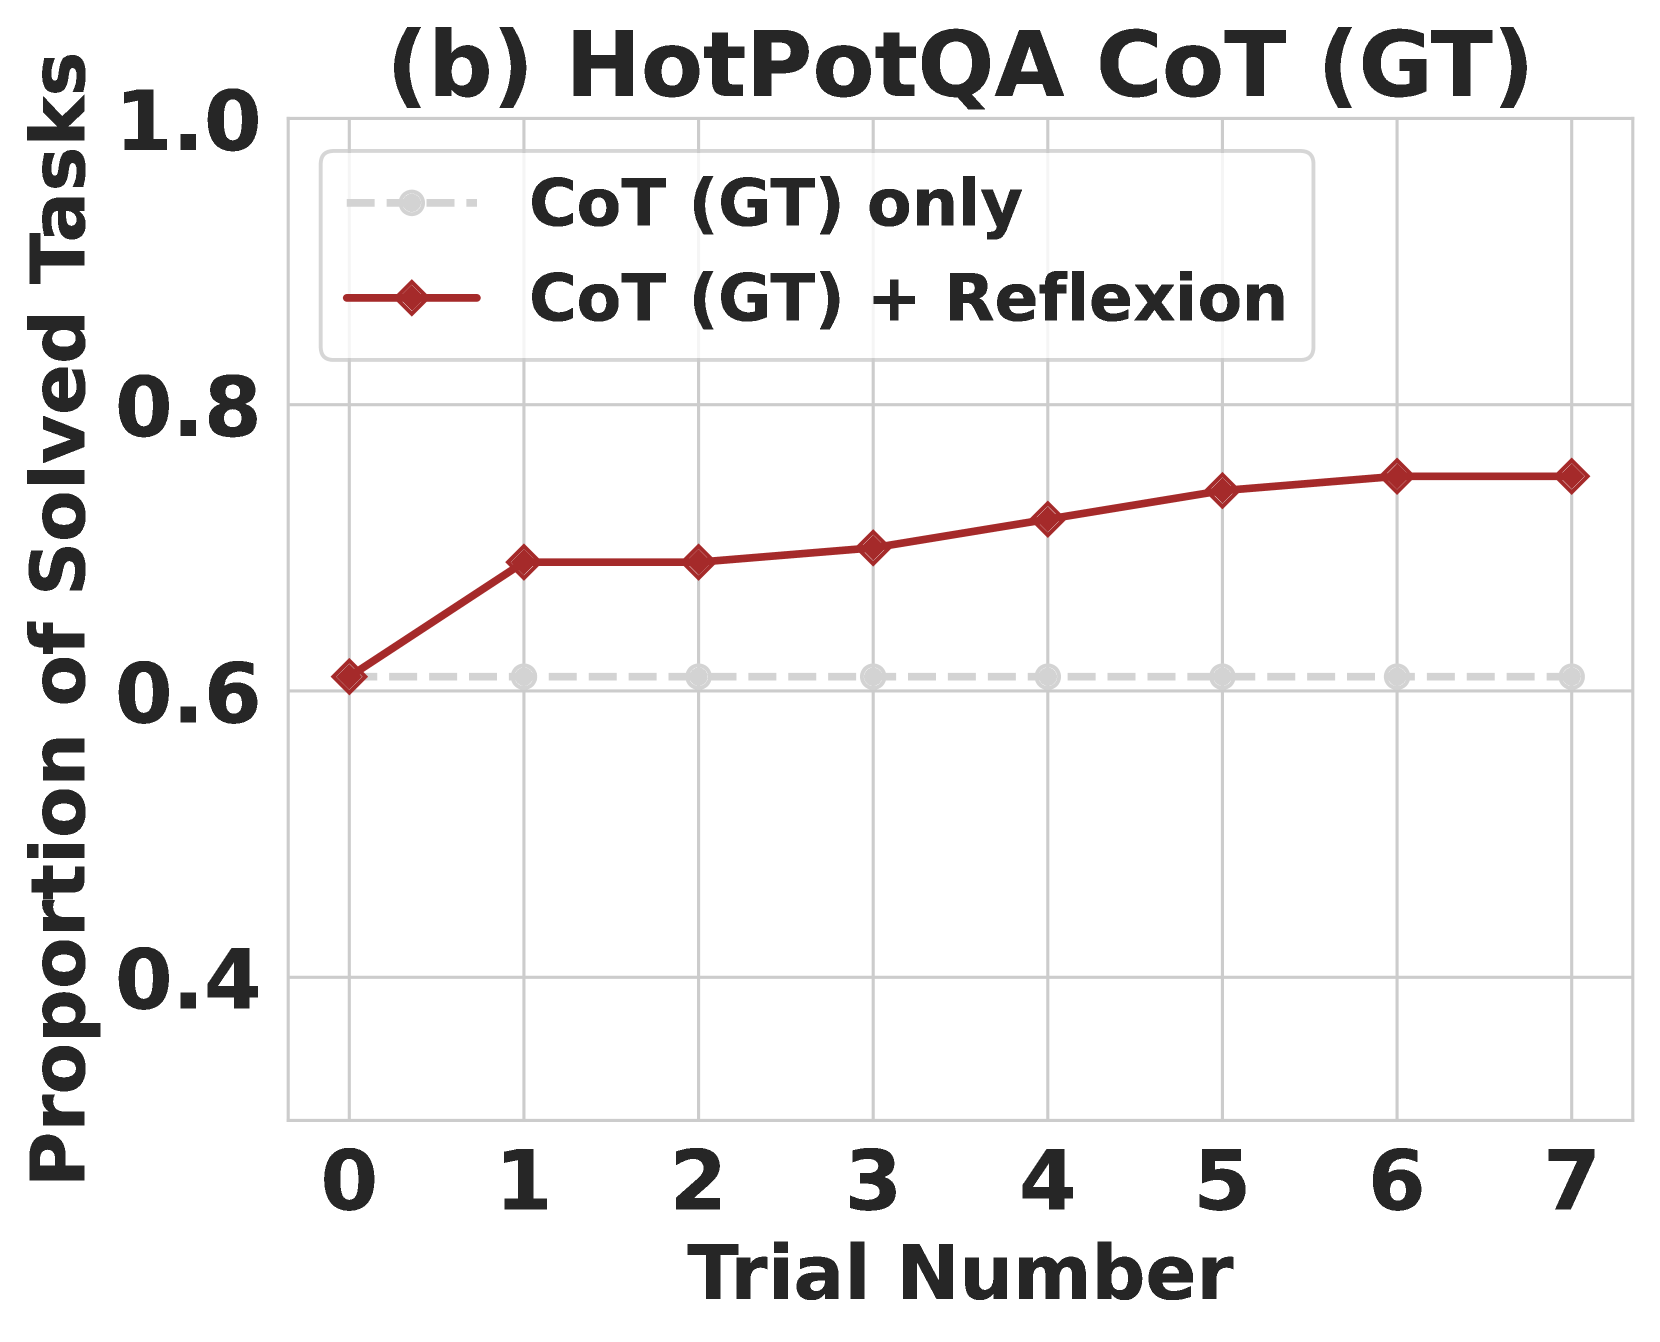
This is a line graph comparing the performance of two reasoning methods on the HotPotQA dataset, tracking the proportion of solved tasks across 8 sequential trials (numbered 0 to 7). The chart evaluates Chain-of-Thought (CoT) with Ground Truth (GT) alone versus CoT (GT) augmented with Reflexion.
### Components/Axes
- **X-axis**: Labeled *Trial Number*, with discrete integer markers: 0, 1, 2, 3, 4, 5, 6, 7 (positioned at the bottom center of the chart).
- **Y-axis**: Labeled *Proportion of Solved Tasks*, with a linear scale ranging from 0.4 to 1.0, marked at intervals of 0.2 (0.4, 0.6, 0.8, 1.0) on the left vertical edge.
- **Legend**: Located in the top-left corner of the chart area, with two entries:
1. *CoT (GT) only*: Represented by a light gray dashed line with light gray circle markers.
2. *CoT (GT) + Reflexion*: Represented by a dark red solid line with dark red diamond markers.
### Detailed Analysis
#### Data Series 1: CoT (GT) only (gray dashed line)
- **Trend**: Flat, with no change in performance across all trials.
- **Approximate Data Points**:
- Trial 0: ~0.61
- Trial 1: ~0.61
- Trial 2: ~0.61
- Trial 3: ~0.61
- Trial 4: ~0.61
- Trial 5: ~0.61
- Trial 6: ~0.61
- Trial 7: ~0.61
#### Data Series 2: CoT (GT) + Reflexion (red solid line)
- **Trend**: Sharp increase from trial 0 to 1, followed by a gradual upward trend through trial 7, with a plateau in the final two trials.
- **Approximate Data Points**:
- Trial 0: ~0.61 (matches the CoT (GT) only value)
- Trial 1: ~0.70
- Trial 2: ~0.70
- Trial 3: ~0.71
- Trial 4: ~0.73
- Trial 5: ~0.75
- Trial 6: ~0.76
- Trial 7: ~0.76
### Key Observations
1. At trial 0, both methods have identical performance (~0.61 proportion of solved tasks).
2. The CoT (GT) + Reflexion method shows a significant performance jump between trial 0 and 1, then continues to improve gradually over subsequent trials.
3. The CoT (GT) only method shows no performance improvement across all 8 trials, remaining static at ~0.61.
4. The performance gap between the two methods widens over trials, starting at 0 and growing to ~0.15 by trial 7.
### Interpretation
This chart demonstrates that adding Reflexion to CoT (GT) enables meaningful performance gains on HotPotQA tasks over repeated trials, whereas CoT (GT) alone yields no improvement with additional attempts. The initial jump in performance for the Reflexion-augmented method suggests that it allows the model to learn or adapt from the first trial, leading to sustained, incremental improvements. The plateau in performance after trial 6 indicates that the model may have reached a performance ceiling for this setup, or that further trials yield diminishing returns. Overall, Reflexion appears to be an effective enhancement for CoT-based reasoning on this dataset, as it unlocks iterative improvement that is absent in the baseline CoT (GT) approach.