# Chart Analysis: (b) HotPotQA CoT (GT)
## Axis Labels
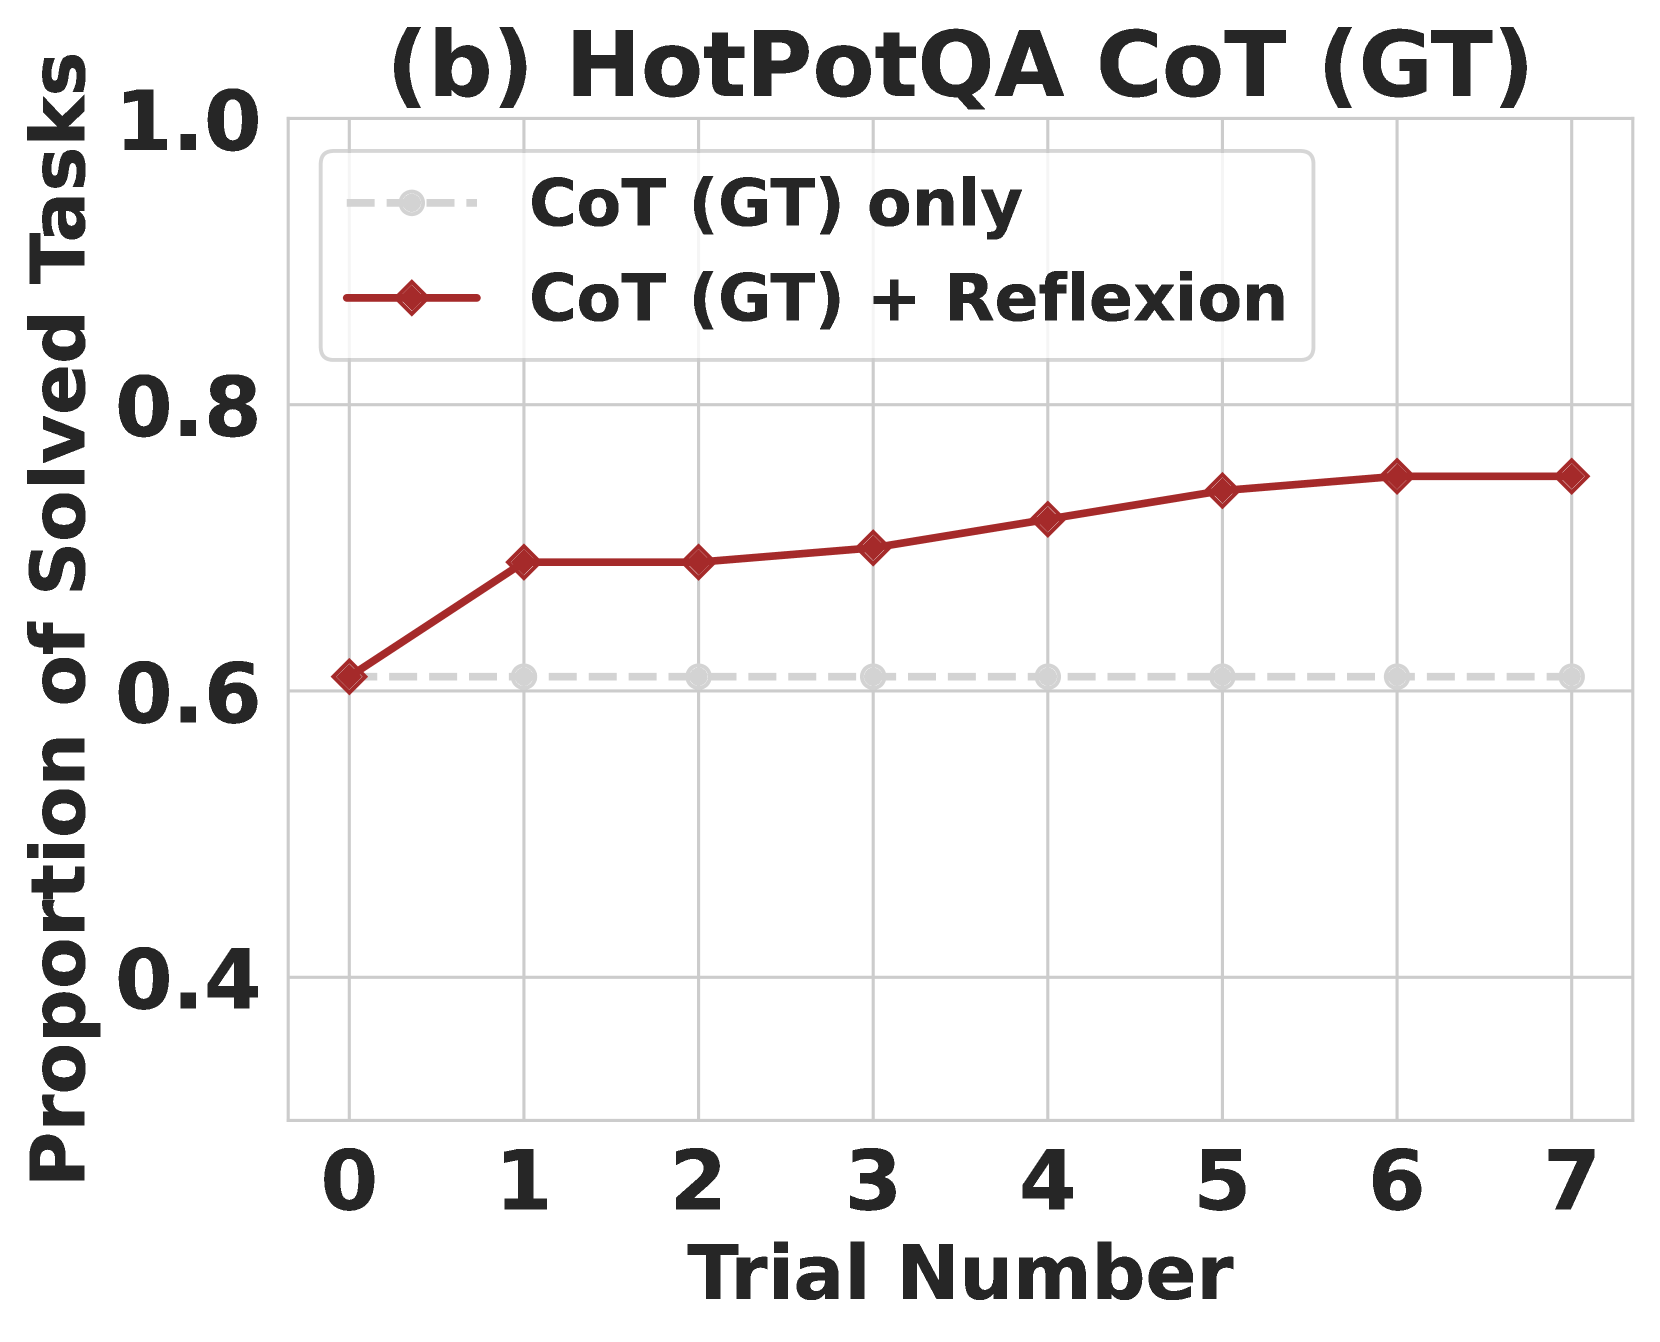
- **X-axis**: Trial Number (0 to 7, integer increments)
- **Y-axis**: Proportion of Solved Tasks (0.4 to 1.0, 0.2 increments)
## Legend
- **Dashed Gray Line**: CoT (GT) only
- **Solid Red Line**: CoT (GT) + Reflexion
## Data Trends
1. **CoT (GT) only** (Dashed Gray):
- Constant value at **0.6** across all trials (0–7).
2. **CoT (GT) + Reflexion** (Solid Red):
- **Trial 0**: 0.6
- **Trial 1**: ~0.7
- **Trial 2**: ~0.7
- **Trial 3**: ~0.7
- **Trial 4**: ~0.7
- **Trial 5**: ~0.75
- **Trial 6**: ~0.75
- **Trial 7**: ~0.75
- **Trend**: Gradual increase from 0.6 (Trial 0) to ~0.75 (Trial 5–7).
## Key Observations
- The "CoT (GT) + Reflexion" group shows improvement over trials, while "CoT (GT) only" remains static.
- Final proportion of solved tasks for "CoT (GT) + Reflexion" stabilizes near **0.75** by Trial 5.