# Technical Document Extraction
## Chart 1: Bar Chart (Count)
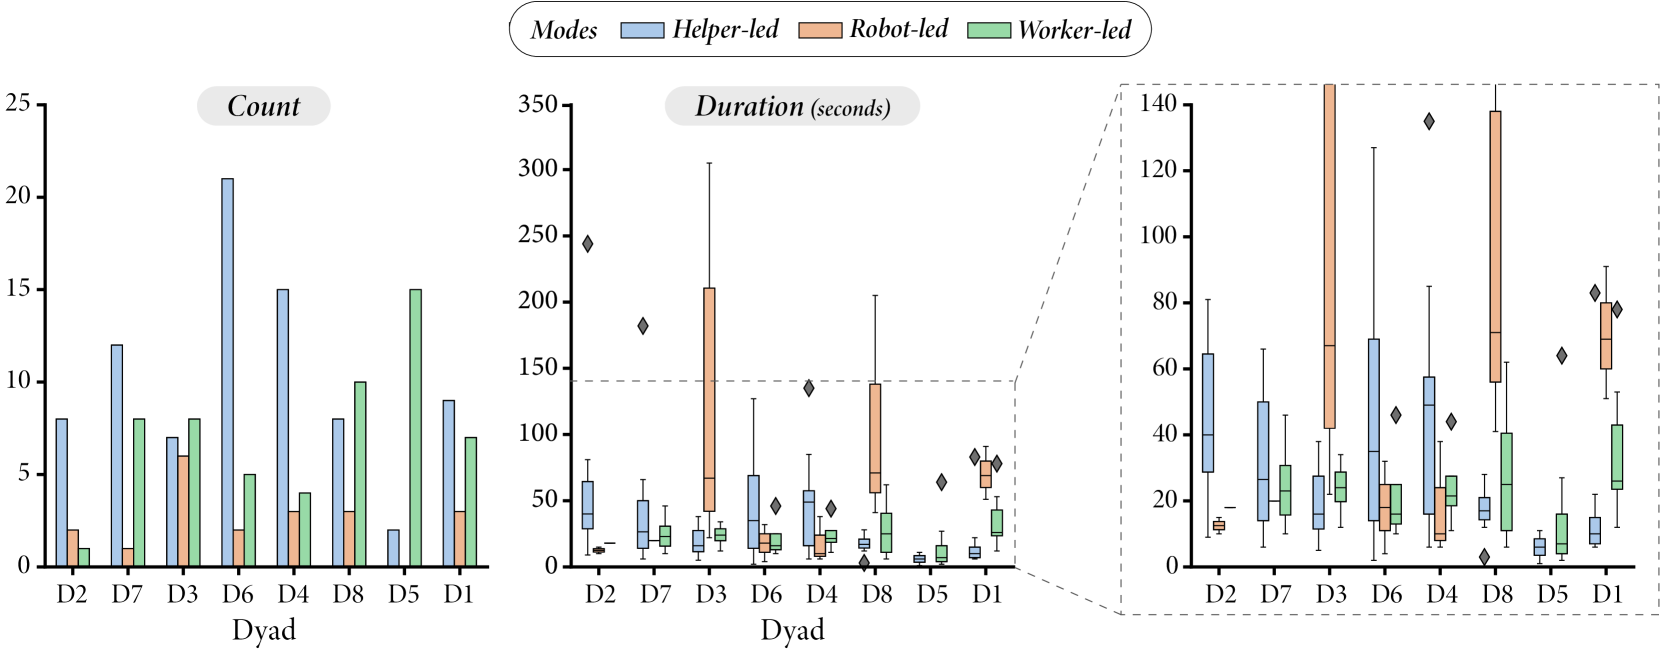
**Title**: Count
**X-axis**: Dyad (categories: D2, D7, D3, D6, D4, D8, D5, D1)
**Y-axis**: Count (0–25)
**Legend**:
- Helper-led: Blue
- Robot-led: Orange
- Worker-led: Green
### Key Data Points:
| Dyad | Helper-led | Robot-led | Worker-led |
|------|------------|-----------|------------|
| D2 | 7 | 2 | 1 |
| D7 | 12 | 1 | 8 |
| D3 | 6 | 6 | 8 |
| D6 | 21 | 2 | 5 |
| D4 | 15 | 3 | 4 |
| D8 | 8 | 5 | 10 |
| D5 | 3 | 0 | 15 |
| D1 | 9 | 3 | 7 |
**Trends**:
- Helper-led (blue) shows peaks at D6 (21) and D4 (15).
- Worker-led (green) peaks at D5 (15).
- Robot-led (orange) has moderate values (max: 6 at D3).
---
## Chart 2: Box Plot (Duration)
**Title**: Duration (seconds)
**X-axis**: Dyad (same categories as above)
**Y-axis**: Duration (0–350)
**Legend**:
- Helper-led: Blue
- Robot-led: Orange
- Worker-led: Green
### Key Observations:
- **Helper-led (blue)**:
- Median ~40 (D2), ~50 (D7), ~30 (D3), ~20 (D6), ~10 (D4), ~5 (D8), ~2 (D5), ~1 (D1).
- Outliers: D2 (60), D7 (80).
- **Robot-led (orange)**:
- Median ~100 (D3), ~80 (D8), ~60 (D6), ~40 (D4), ~20 (D1).
- Outliers: D3 (200), D8 (140).
- **Worker-led (green)**:
- Median ~30 (D2), ~20 (D7), ~10 (D3), ~5 (D6), ~2 (D4), ~1 (D8), ~0.5 (D5), ~0.2 (D1).
**Trends**:
- Robot-led (orange) dominates in D3 (200) and D8 (140).
- Helper-led (blue) has lower medians but higher variability (e.g., D2: 40 median, 60 outlier).
---
## Chart 3: Scatter Plot (Duration)
**Title**: Duration (seconds)
**X-axis**: Dyad (same categories)
**Y-axis**: Duration (0–140)
**Legend**:
- Helper-led: Blue
- Robot-led: Orange
- Worker-led: Green
### Key Data Points:
| Dyad | Helper-led | Robot-led | Worker-led |
|------|------------|-----------|------------|
| D2 | 60 | 10 | 10 |
| D7 | 50 | 20 | 20 |
| D3 | 40 | 120 | 30 |
| D6 | 30 | 80 | 40 |
| D4 | 20 | 60 | 50 |
| D8 | 10 | 140 | 60 |
| D5 | 5 | 100 | 70 |
| D1 | 2 | 80 | 80 |
**Error Bars**:
- Helper-led (blue): ±10–20 (e.g., D2: 60 ± 20).
- Robot-led (orange): ±20–40 (e.g., D3: 120 ± 40).
- Worker-led (green): ±5–10 (e.g., D2: 10 ± 10).
**Trends**:
- Robot-led (orange) shows exponential growth in D3 (120) and D8 (140).
- Worker-led (green) increases linearly (D1: 80).
---
## Spatial Grounding & Validation
- **Legend Position**: Top-right corner of all charts.
- **Color Consistency**:
- Helper-led (blue) matches all blue bars, boxes, and scatter points.
- Robot-led (orange) matches orange bars, boxes, and scatter points.
- Worker-led (green) matches green bars, boxes, and scatter points.
## Notes
- No textual information beyond axis labels, titles, and legends.
- All data is numerical and visually represented.
- No non-English text detected.