## Line Chart: τ²-bench Score over ROAD Iteration Rounds
### Overview
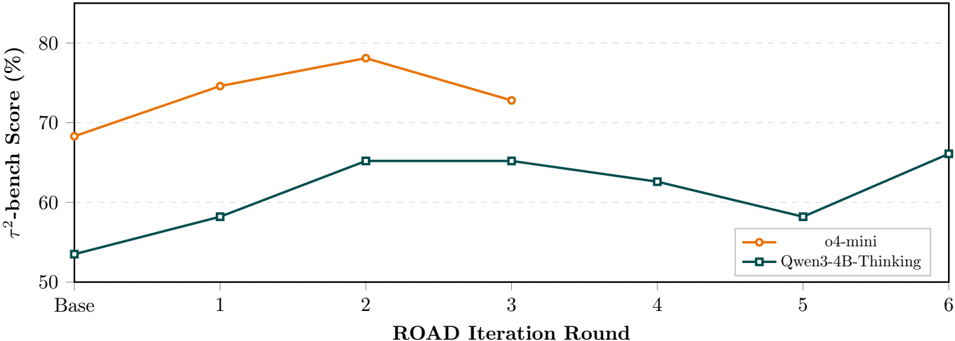
This line chart illustrates the performance of two models, "o4-mini" and "Qwen3-4B-Thinking," on the "τ²-bench Score (%)" across several "ROAD Iteration Rounds." The chart shows how the scores change from a "Base" round through subsequent iterations.
### Components/Axes
* **Y-axis:** Represents the "τ²-bench Score (%)." The scale ranges from 50 to 80, with major grid lines marked at 50, 60, 70, and 80.
* **X-axis:** Represents the "ROAD Iteration Round." The labels are "Base", "1", "2", "3", "4", "5", and "6".
* **Legend:** Located in the bottom-right corner, it identifies the two data series:
* **Orange line with circle markers:** "o4-mini"
* **Dark teal line with square markers:** "Qwen3-4B-Thinking"
### Detailed Analysis
#### **o4-mini (Orange Line)**
* **Trend:** The line starts at a relatively high score, increases to a peak, and then decreases. The series ends after Round 3.
* **Data Points (Approximate):**
* **Base:** ~68%
* **Round 1:** ~74.5%
* **Round 2:** ~78% (Peak)
* **Round 3:** ~72.5%
#### **Qwen3-4B-Thinking (Dark Teal Line)**
* **Trend:** The line starts at a lower score, increases to a plateau, decreases over two rounds, and then shows a final increase. The series continues through Round 6.
* **Data Points (Approximate):**
* **Base:** ~53.5%
* **Round 1:** ~58%
* **Round 2:** ~65%
* **Round 3:** ~65% (Plateau)
* **Round 4:** ~62.5%
* **Round 5:** ~58%
* **Round 6:** ~66%
### Key Observations
1. **Performance Gap:** The "o4-mini" model consistently achieves higher scores than the "Qwen3-4B-Thinking" model in all rounds where both are present (Base through Round 3). The gap is substantial, ranging from approximately 7.5% to 14.5%.
2. **Peak Performance:** Both models show an initial improvement from the "Base" round. "o4-mini" peaks at Round 2, while "Qwen3-4B-Thinking" reaches a plateau at Rounds 2 and 3.
3. **Performance Decline:** After their respective peaks/plateaus, both models experience a decline in score. "o4-mini" drops from Round 2 to 3. "Qwen3-4B-Thinking" drops from Round 3 to 5.
4. **Late Recovery:** The "Qwen3-4B-Thinking" model shows a notable recovery in score from Round 5 to Round 6, reaching a level slightly higher than its previous plateau.
5. **Different Iteration Lengths:** The "o4-mini" process is shown for only 3 iterations after the base, whereas the "Qwen3-4B-Thinking" process continues for 6 iterations.
### Interpretation
The data suggests that the "ROAD Iteration" process is initially beneficial for both models, leading to improved "τ²-bench Scores." However, the benefits appear to be non-monotonic. For "o4-mini," the optimal performance is reached at Round 2, after which further iteration leads to a regression. For "Qwen3-4B-Thinking," the process yields gains up to Round 2/3, followed by a period of performance degradation, and then a final recovery at Round 6. This indicates that the iteration process may need to be carefully managed and potentially stopped at an optimal point to maximize performance, or that later rounds may introduce new dynamics that can eventually lead to improvements after a temporary setback. The "o4-mini" model demonstrates a higher overall capability on this benchmark compared to "Qwen3-4B-Thinking."