## Line Chart: Model Accuracy vs. Sample Size
### Overview
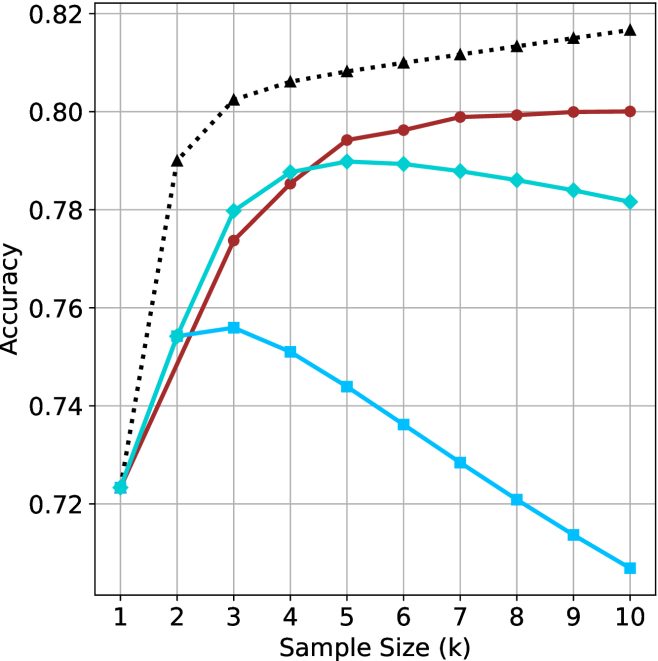
The chart compares the accuracy of three models (A, B, C) across sample sizes (k=1 to 10). Accuracy is measured on a y-axis (0.72–0.82), while the x-axis represents sample size. Three distinct trends are observed: Model A (black dotted) shows rapid improvement and stabilization, Model B (red solid) demonstrates gradual improvement with plateauing, and Model C (blue solid) peaks early before declining.
### Components/Axes
- **X-axis**: "Sample Size (k)" with integer markers (1–10).
- **Y-axis**: "Accuracy" scaled in 0.02 increments (0.72–0.82).
- **Legend**: Located in the top-right corner, associating:
- Black dotted line → "Model A"
- Red solid line → "Model B"
- Blue solid line → "Model C"
### Detailed Analysis
1. **Model A (Black Dotted Line)**:
- Starts at 0.72 (k=1).
- Sharp upward trend to 0.80 at k=2.
- Remains stable at ~0.80 for k=3–10.
- **Key Data Points**:
- k=1: 0.72
- k=2: 0.80
- k=3–10: ~0.80
2. **Model B (Red Solid Line)**:
- Begins at 0.72 (k=1).
- Gradual ascent to 0.78 at k=3.
- Plateaus between 0.79–0.80 for k=4–10.
- **Key Data Points**:
- k=1: 0.72
- k=3: 0.78
- k=4: 0.79
- k=10: 0.80
3. **Model C (Blue Solid Line)**:
- Starts at 0.72 (k=1).
- Peaks at 0.76 at k=2.
- Declines steadily to 0.71 by k=10.
- **Key Data Points**:
- k=1: 0.72
- k=2: 0.76
- k=10: 0.71
### Key Observations
- **Model A** consistently outperforms others, achieving the highest accuracy (0.80) by k=2 and maintaining it.
- **Model B** improves with sample size but plateaus at ~0.80, suggesting diminishing returns.
- **Model C** exhibits a U-shaped trend: initial improvement followed by a sharp decline, indicating potential overfitting or inefficiency at larger sample sizes.
### Interpretation
The data suggests:
1. **Model A** is optimal for all sample sizes, likely due to robust architecture or regularization.
2. **Model B** benefits from larger samples but lacks the efficiency of Model A.
3. **Model C**'s decline after k=2 implies overfitting or poor generalization to larger datasets. This could stem from architectural limitations (e.g., high variance) or insufficient training data for larger k.
The trends highlight the importance of model selection based on dataset size and the trade-offs between complexity and generalization.