TECHNICAL ASSET FINGERPRINT
4d9b070e1201c765eb3d5d77
Click to view fullscreen
Press ESC or click to close
FOUND IN PAPERS
EXPERT: healer-alpha-free VERSION 1
RUNTIME: free/openrouter/healer-alpha
INTEL_VERIFIED
## Diagram and Charts: Variable Relationships and Importance Analysis
### Overview
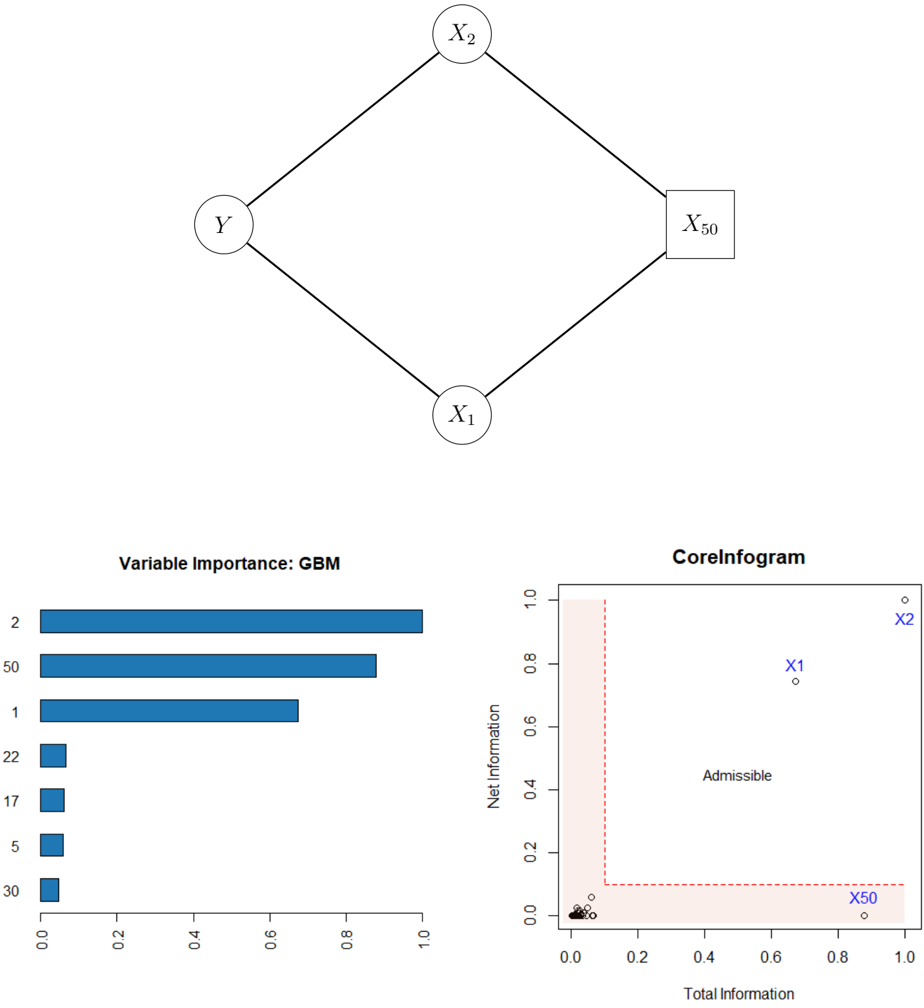
The image is a composite of three distinct visual elements arranged in a layout. The top section contains a network diagram illustrating relationships between four variables. The bottom section is split into two charts: a horizontal bar chart on the left titled "Variable Importance: GBM" and a scatter plot on the right titled "CoreInfogram." The overall content appears to be from a technical or statistical analysis, likely related to machine learning model interpretation and feature evaluation.
### Components/Axes
**1. Top Diagram (Network Structure):**
* **Type:** Diamond-shaped network or causal diagram.
* **Nodes:** Four nodes are present.
* A circle labeled **Y** (left vertex).
* A circle labeled **X₁** (bottom vertex).
* A circle labeled **X₂** (top vertex).
* A square labeled **X₅₀** (right vertex).
* **Edges:** Lines connect the nodes in a diamond pattern: Y to X₂, Y to X₁, X₂ to X₅₀, and X₁ to X₅₀. The square shape for X₅₀ may denote a different type of variable (e.g., an observed or target variable) compared to the circular nodes.
**2. Bottom-Left Chart (Variable Importance: GBM):**
* **Title:** "Variable Importance: GBM" (GBM likely stands for Gradient Boosting Machine).
* **Chart Type:** Horizontal bar chart.
* **Y-axis (Categories):** Lists variable identifiers. From top to bottom: **2, 50, 1, 22, 17, 5, 30**.
* **X-axis (Values):** Represents importance score, scaled from **0.0 to 1.0**. Major tick marks are at 0.0, 0.2, 0.4, 0.6, 0.8, 1.0.
* **Bars:** Blue horizontal bars extend from the y-axis to the right. Their length corresponds to the importance value.
**3. Bottom-Right Chart (CoreInfogram):**
* **Title:** "CoreInfogram".
* **Chart Type:** Scatter plot.
* **X-axis:** Labeled **"Total Information"**. Scale ranges from **0.0 to 1.0** with ticks at 0.0, 0.2, 0.4, 0.6, 0.8, 1.0.
* **Y-axis:** Labeled **"Net Information"**. Scale ranges from **0.0 to 1.0** with ticks at 0.0, 0.2, 0.4, 0.6, 0.8, 1.0.
* **Data Points:** Several small black circles are plotted. Three specific points are labeled in blue text:
* **X1:** Positioned at approximately (Total=0.7, Net=0.75).
* **X2:** Positioned at approximately (Total=1.0, Net=1.0).
* **X50:** Positioned at approximately (Total=0.9, Net=0.0).
* **Annotations:**
* A red dashed line forms an "L" shape, creating a boundary. The vertical segment is at Total Information ≈ 0.1, and the horizontal segment is at Net Information ≈ 0.1.
* The region to the left of the vertical line and below the horizontal line is shaded in light pink.
* The word **"Admissible"** is printed in the central white region of the plot, suggesting points in this area meet a certain criterion.
### Detailed Analysis
**Variable Importance Chart:**
* **Trend:** Importance scores decrease from the top variable to the bottom variable.
* **Data Points (Approximate Values):**
* Variable **2**: Importance ≈ **1.0** (highest).
* Variable **50**: Importance ≈ **0.88**.
* Variable **1**: Importance ≈ **0.68**.
* Variable **22**: Importance ≈ **0.08**.
* Variable **17**: Importance ≈ **0.07**.
* Variable **5**: Importance ≈ **0.06**.
* Variable **30**: Importance ≈ **0.05** (lowest).
**CoreInfogram Scatter Plot:**
* **Spatial Grounding & Trend Verification:**
* **X2 (Top-Right):** This point has the highest possible values on both axes (Total Information ≈ 1.0, Net Information ≈ 1.0). It is an outlier in the top-right corner.
* **X1 (Center-Right):** This point has high Total Information (≈0.7) and high Net Information (≈0.75). It lies within the "Admissible" region.
* **X50 (Bottom-Right):** This point has high Total Information (≈0.9) but very low Net Information (≈0.0). It lies in the pink-shaded region below the horizontal red dashed line.
* **Cluster (Bottom-Left):** A tight cluster of unlabeled points is located near the origin (Total < 0.1, Net < 0.1), within the pink-shaded region.
### Key Observations
1. **Variable Discrepancy:** The variable labeled **50** (or **X₅₀**) shows a significant discrepancy between its high importance in the GBM model (2nd highest) and its position on the CoreInfogram, where it has high Total Information but near-zero Net Information, placing it in the "inadmissible" zone.
2. **Top Performer:** Variable **2** (likely corresponding to **X₂** in the diagram) is the most important in the GBM and also scores perfectly on the CoreInfogram (Total=1, Net=1).
3. **Admissible vs. Inadmissible:** The CoreInfogram defines a clear "Admissible" region (Total > ~0.1 and Net > ~0.1). Only variables **X1** and **X2** fall into this region. **X50** and the cluster of other variables are deemed inadmissible.
4. **Network vs. Metrics:** The network diagram shows **X₅₀** as a central node connected to both **X₁** and **X₂**, yet its informational properties (per the CoreInfogram) are poor, suggesting its role in the network may not translate to useful predictive information.
### Interpretation
This composite image presents a multi-faceted analysis of feature variables in a predictive modeling context.
* **The Diagram** establishes a hypothesized structural relationship between a target variable **Y** and three features: **X₁**, **X₂**, and **X₅₀**. The square node for **X₅₀** might indicate it is a derived or special variable.
* **The GBM Importance Chart** provides a model-based, empirical ranking of feature utility. It confirms **X₂** (variable 2) as the most critical predictor, followed by **X₅₀** (variable 50) and **X₁** (variable 1). The sharp drop-off after these three suggests a sparse feature set where only a few variables drive predictions.
* **The CoreInfogram** offers a theoretical or information-theoretic evaluation. It separates features based on their "Total Information" (likely raw predictive power or correlation with the target) and "Net Information" (possibly information adjusted for redundancy or noise). The plot reveals that while **X₅₀** has high total information, its net information is negligible, implying its predictive power is redundant or confounded—perhaps because it is a composite of **X₁** and **X₂** as suggested by the diagram. **X₁** and **X₂** provide high, non-redundant ("admissible") information.
**Conclusion:** The analysis suggests that **X₂** is the most valuable feature, being both highly important to the GBM model and informationally rich and unique. **X₁** is also a strong, admissible feature. **X₅₀**, despite its high model importance, is informationally suspect; its predictive value may be an artifact of its relationship with **X₁** and **X₂** rather than independent merit. This could guide feature selection: retaining **X₁** and **X₂** while investigating or potentially removing **X₅₀** to simplify the model without losing true predictive power. The cluster of low-importance, inadmissible variables near the origin can likely be discarded.
DECODING INTELLIGENCE...