## Diagram: Network Structure with Nodes and Connections
### Overview
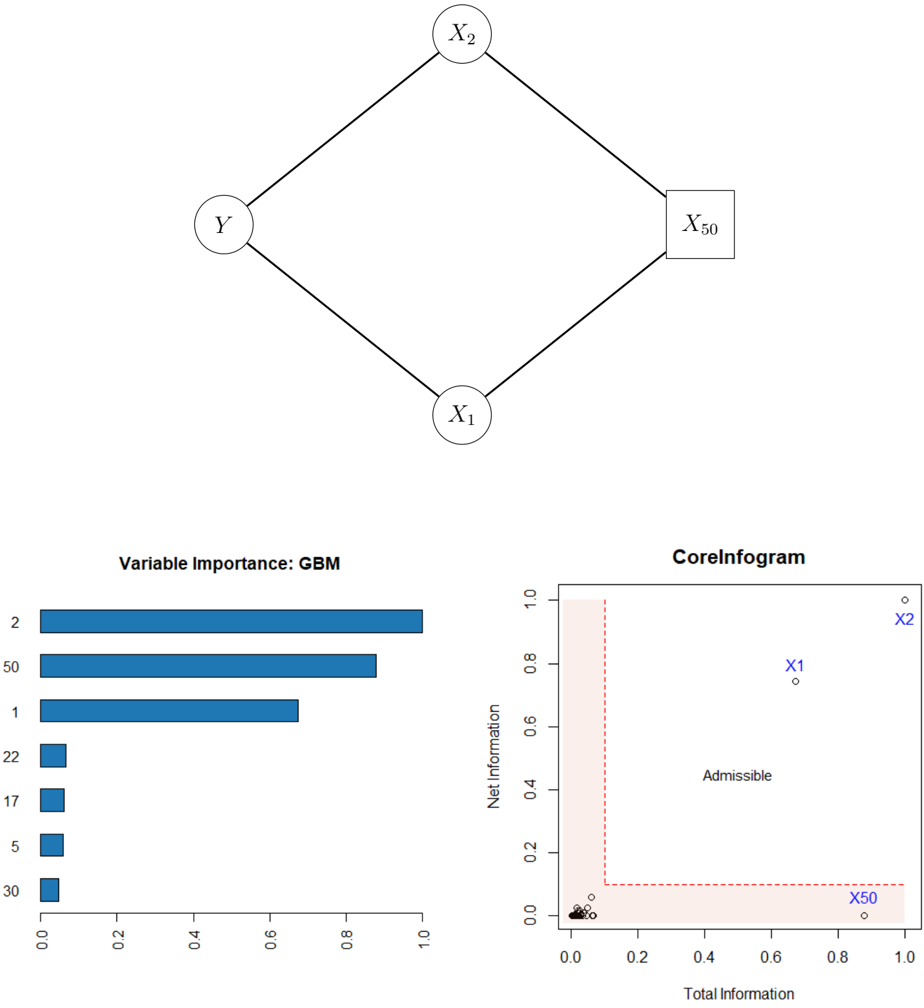
The image contains a diamond-shaped diagram with four nodes labeled **Y**, **X₁**, **X₂**, and **X₅₀**. Nodes are connected via straight edges, forming a hierarchical or dependency structure. **X₅₀** is distinguished by a square shape, while other nodes are circles.
### Components/Axes
- **Nodes**:
- **Y** (top-left)
- **X₁** (bottom-left)
- **X₂** (top-right)
- **X₅₀** (bottom-right, square-shaped)
- **Edges**:
- **Y** → **X₁**
- **Y** → **X₂**
- **X₁** → **X₅₀**
- **X₂** → **X₅₀**
### Detailed Analysis
- **Node Labels**: All nodes are explicitly labeled with uppercase letters.
- **Node Shapes**: **X₅₀** is a square; others are circles.
- **Edge Directions**: All edges are unidirectional, suggesting a flow or dependency from parent to child nodes.
### Key Observations
- **X₅₀** is the terminal node, receiving input from both **X₁** and **X₂**.
- **Y** acts as a root node, branching into **X₁** and **X₂**.
### Interpretation
This diagram likely represents a decision tree, causal model, or dependency graph. **X₅₀** may be the output or target variable, influenced by **X₁** and **X₂**, which are themselves influenced by **Y**. The square shape of **X₅₀** could indicate a special role (e.g., final output or critical node).
---
## Chart: Variable Importance (GBM)
### Overview
A horizontal bar chart titled **"Variable Importance: GBM"** displays the relative importance of variables in a Gradient Boosting Machine (GBM) model. The x-axis ranges from 0.0 to 1.0, and the y-axis lists categorical variables.
### Components/Axes
- **X-axis**: "Importance Score" (0.0 to 1.0)
- **Y-axis**: Categorical variables: **2**, **50**, **1**, **22**, **17**, **5**, **30**
- **Legend**: Blue bars represent variable importance.
### Detailed Analysis
- **Variable Importance Scores**:
- **2**: ~0.95 (longest bar)
- **50**: ~0.85
- **1**: ~0.65
- **22**, **17**, **5**, **30**: ~0.1 each (short bars)
- **Spatial Grounding**:
- Bars are aligned horizontally, with **2** at the top and **30** at the bottom.
- Legend is on the right, matching the blue color of the bars.
### Key Observations
- **Variable 2** is the most important, contributing ~95% of the importance score.
- **Variables 22, 17, 5, and 30** have negligible importance (~10% each).
### Interpretation
This chart highlights the dominance of **Variable 2** in the GBM model, suggesting it is the primary driver of predictions. The low importance of other variables implies they contribute minimally to the model’s output.
---
## Chart: CoreInfogram
### Overview
A scatter plot titled **"CoreInfogram"** visualizes the relationship between **Total Information** (x-axis) and **Net Information** (y-axis). Points are labeled **X₁**, **X₂**, and **X₅₀**, with a red dashed boundary defining an "Admissible" region.
### Components/Axes
- **X-axis**: "Total Information" (0.0 to 1.0)
- **Y-axis**: "Net Information" (0.0 to 1.0)
- **Legend**:
- **X₁**: Circle (blue)
- **X₂**: Square (blue)
- **X₅₀**: Triangle (blue)
- **Boundary**: Red dashed lines at **x=0.2** and **y=0.1**, forming a rectangular "Admissible" region.
### Detailed Analysis
- **Data Points**:
- **X₂**: (0.9, 0.95) – top-right corner, outside the admissible region.
- **X₁**: (0.7, 0.75) – inside the admissible region.
- **X₅₀**: (0.9, 0.05) – bottom-right corner, outside the admissible region.
- **Boundary**:
- Red dashed lines at **x=0.2** (vertical) and **y=0.1** (horizontal).
- "Admissible" region is the area above **y=0.1** and to the right of **x=0.2**.
### Key Observations
- **X₂** and **X₅₀** lie outside the admissible region, while **X₁** is inside.
- The admissible region suggests a threshold for acceptable information content.
### Interpretation
The CoreInfogram evaluates the balance between total and net information. Points outside the admissible region (e.g., **X₂**, **X₅₀**) may indicate inefficiencies or noise in the data. **X₁**’s position within the admissible region suggests it meets the criteria for meaningful information.
---
## Final Notes
- **Language**: All text is in English.
- **Missing Data**: No numerical tables or additional text blocks are present.
- **Uncertainty**: Approximate values (e.g., ~0.95 for Variable 2) are based on visual estimation.