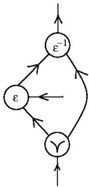
## Diagram: Knot Diagram with Labels
### Overview
The image is a knot diagram, a type of mathematical representation used to visualize and analyze knots. It consists of lines and circles, with arrows indicating the direction of flow or orientation. The diagram includes labels within the circles, specifically epsilon, epsilon inverse, and a Y-like symbol.
### Components/Axes
* **Nodes:** Three circular nodes are present in the diagram.
* Top node: Labeled "ε⁻¹" (epsilon inverse).
* Middle-left node: Labeled "ε" (epsilon).
* Bottom node: Labeled "Y" (a Y-shaped symbol).
* **Lines/Edges:** Lines connect the nodes, representing strands of the knot. Arrows on the lines indicate direction.
* **Arrows:** Arrows indicate the direction of flow along the lines.
* **External Lines:** Two lines extend from the top and bottom of the diagram, each with an arrow pointing upwards.
### Detailed Analysis
* **Top Node (ε⁻¹):**
* One line enters the node from the middle-left (ε) node, flowing upwards.
* One line enters the node from the bottom (Y) node, flowing upwards and curving to the right.
* One line exits the node upwards, continuing the flow.
* **Middle-Left Node (ε):**
* One line enters the node from the top (ε⁻¹) node, flowing downwards.
* One line exits the node horizontally to the right.
* One line exits the node downwards towards the bottom (Y) node.
* **Bottom Node (Y):**
* One line enters the node from the middle-left (ε) node, flowing downwards.
* One line enters the node from the top (ε⁻¹) node, flowing downwards.
* One line exits the node downwards, continuing the flow.
### Key Observations
* The diagram represents a flow or transformation process, with the arrows indicating the direction of the process.
* The epsilon and epsilon inverse nodes suggest an inverse relationship or operation.
* The Y-shaped symbol at the bottom node might represent a branching or merging point in the process.
### Interpretation
The diagram likely represents a mathematical or physical process involving transformations and relationships between different elements. The epsilon and epsilon inverse nodes could represent a variable and its inverse, while the Y-shaped node could represent a point where two inputs are combined into a single output. The overall structure suggests a cyclical or iterative process, with the flow returning to the starting point. The specific meaning of the diagram would depend on the context in which it is used.