\n
## Diagram: State Transition Diagram
### Overview
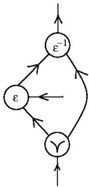
The image depicts a state transition diagram with three states labeled ε (epsilon), ε⁻¹ (epsilon inverse), and γ (gamma). Arrows indicate transitions between these states, with input and output flows.
### Components/Axes
The diagram consists of:
* **States:** ε, ε⁻¹, γ
* **Transitions:** Arrows connecting the states, indicating flow direction.
* **Input/Output:** Arrows entering and exiting the diagram, representing input and output signals.
### Detailed Analysis or Content Details
The diagram shows a cyclical flow between the three states.
1. **State ε:** Located on the left side of the diagram. An arrow enters from the top, and an arrow exits to the bottom. An arrow also points from γ to ε.
2. **State ε⁻¹:** Located at the top of the diagram. An arrow enters from ε, and an arrow exits to the top. An arrow also points from γ to ε⁻¹.
3. **State γ:** Located at the bottom of the diagram. An arrow enters from ε⁻¹, and an arrow exits to the bottom. An arrow also points from ε to γ.
The arrows indicate a flow where:
* Input enters ε, transitions to γ, then to ε⁻¹, and finally back to ε.
* Input enters ε⁻¹, transitions to ε, then to γ, and finally back to ε⁻¹.
* Input enters γ, transitions to ε, then to ε⁻¹, and finally back to γ.
### Key Observations
The diagram represents a closed-loop system with three distinct states and transitions between them. The cyclical nature suggests a repeating process or a system that continuously cycles through these states.
### Interpretation
This diagram likely represents a mathematical or computational process involving transformations or operations represented by the states ε, ε⁻¹, and γ. The cyclical nature suggests an iterative process or a system that maintains a state of equilibrium through continuous transitions. The symbols ε and ε⁻¹ suggest an inverse operation, potentially related to an identity or reversal process. The γ state could represent a different type of transformation or a condition that triggers transitions between ε and ε⁻¹. Without further context, it's difficult to determine the specific meaning of these states and transitions, but the diagram clearly illustrates a dynamic system with a defined set of states and transitions. It could be a simplified representation of a more complex system, such as a finite state machine or a control system.